Sometimes implementing relatively simple ideas requires a surprising amount of creativity. The pie chart in Izenda has a simple option to combine smaller pie slices into a single slice. If you have twenty countries, but many are very small, the chart will look a bit cluttered. The tiny slices distract from the overall message without giving a lot of meaning.
We recently added the ability to combine the bottom slices into a single “Other” slice. This worked so well that a customer wanted to use it for many other parts of their system. Now, our “Other” feature works well for a pie chart because there are a very small number of slices anyway. We needed something that could work on billions of records and quickly summarize the top 5 countries, while also giving the sum of all remaining countries as a single row.
The Solution
While we came up with a few ways to solve this problem, the simplest was to do a UNION. A union essentially combines the results of two queries into a single one. To make this work, the field names for all queries have to be the same. So you could take two radically different queries, but alias the resulting fields so they match and essentially “stack” the queries on top of each other. The next challenge was that there is no BOTTOM feature. Ideally, we could do a TOP 5 and a BOTTOM 95 and union the results together. Lacking this features, we had to simulate it with ROWNUMBER()
So the easy part is to find out how many orders we have in each country. This involves a simple COUNT combined with an ORDER BY and TOP. We use DESC here to sort in descending order which promotes the higher numbers.
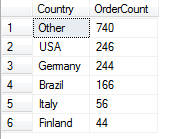
SELECT TOP 5 ShipCountry AS Country, Count(OrderID) AS OrderCount FROM
Orders GROUP BY ShipCountry ORDER BY OrderCount DESC
The rest is a bit tricky. There are couple of steps involved. Essentially we create a query which provides both a count and ROW_NUMBER() which we use to simulate BOTTOM. We then use a WITH statement to transform the results into a format that is compatible with our first query:
WITH Countries AS (
SELECT TOP 1000000 ShipCountry, Count(OrderID) AS Orders,ROW_NUMBER()
OVER (ORDER BY Count(OrderID)) as RowNum
FROM Orders
GROUP BY ShipCountry
ORDER BY Count(OrderID) DESC
)
Now we simply UNION these together to get the following results. This code could be used in a view or stored procedure that powers an executive dashboard.
Doing it Faster
Another approach that will perform better is to use the CASE statement. Rather than unioning multiple queries which will require multiple scans, we will use a CASE to translate rows above 5. This also prevents us from having to do the inner query to do the count. We’ll cover that in Part 2.