 How do we improve the adoption by users of our self-service, embedded Business Intelligence?
A TDWI survey of technical and business professionals found that an overwhelming 78% of respondents said that they needed a faster time to value from BI solutions. Making BI reporting and analytic capabilities easy to use received the highest rating of the four objectives of self-service BI. Some 78% of survey respondents rated this as “very important.”
BI and analytics has opened up new opportunities for organizations to analyze the data, according to a Business Intelligence Platform Market report, and use these solutions to enhance the overall efficiency of businesses. The complex implementation process and lack of experienced professionals in the organizations has caused a shortfall in its use.
Self-service BI has been seen as the answer to this barrier to the use of BI – but only if it is easy to use.
Self-service BI is not about the tools or about delivering reports, according to Helen Frericks, Sr. Manager of Business Applications Development at Entegris. She said it’s about a mindset: “How do we make it so that our users are able to help themselves to understand the data better, have better access to it, and have the ability to react more quickly to their demands within the business world?”
Any self-service BI system serves a variety of users:
- Casual end users – These users don’t want to build reports. Typically best served by embedded BI with built-in templates. These casual users simply adjust report parameters when needed.
- Power users – These early adopters are dedicated in their use of BI, often in fields such as marketing, sales and finance. They need to run more complex reports and require freedom and flexibility with these self-service tools.
Tools for self-service, BI must be easy to understand and user friendly. Advanced data visualization makes the top three for requirements of business users, according to a TDWI research report. Data visualization helps the average user easily understand the reports they generate and offers the more experienced users a way to make new connections.
The power user is IT’s secret weapon in getting a self-service BI strategy adopted. Self-service is nothing without the support of the power users, those employees with an aptitude for technology. Frericks said each power user becomes the go to person within their department for others users with questions about the self-service BI solution. They provide ongoing training and assistance to their coworkers, freeing a huge amount of time for IT.
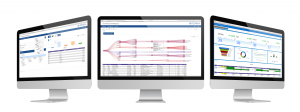
One of the easiest ways to get the end users on board will be to integrate an embedded platform of self-service BI. Embedded BI assures stronger user adoption and satisfaction because users don’t have to learn a new interface. Users are free to explore reports, dashboards and visualizations in real-time within the applications they use every day. So the end users don’t have to log in to another portal, they see everything they need in one place. Powerful aliasing and categorization settings can present the end-user with an easy to understand, business relevant set of names and groupings.
An embedded self-service BI solution allows users to hit the ground running with a library of core reports and dashboard templates. Vendors can deploy it safely to their entire customer base. It allows them to create their own customizations. This creates massive, self-sufficient user communities.
Additional ways to push adoption include a tip offered by Gartner analyst Rita Sallam in an Enterprise Apps Today article. She said companies underestimate costs of business intelligence training and user enablement. A solution Sallam suggested would be for companies to think about highlighting a BI ‘feature of the day,’ running ‘lunch and learn’ sessions or providing online videos – things like that.”
At EDIMS, a browser-based reporting environment providing simple customizations was integrated as an embedded, self-service BI solution. EDIMS clients, without IT and without formal training, were able to immediately use a real time dashboard providing true ad hoc reporting. These clients, working in busy hospital and clinic environments, are able to have specific key reports ready immediately and automatically delivered.
Non-technical users at retail outlets could manage an embedded, self-service BI tool with ease in a solution provided through LP Software. Adding a field to a report took just a few clicks and in seconds the report was modified. The graphing capabilities were another important feature, something that LP Software had not offered in the past, but that customers had often commented as something that would be great to have. They found that it did everything they needed it to do and would be very easy for new users to learn.
Izenda Vision™ is a dynamic framework for advanced visualizations that comes with a library of more than a dozen powerful animated, interactive charts, graphs and more. Give your users the power to display and comprehend their data in completely new ways with the advanced visualizations found in Izenda Vision™. It features dynamic visualizations such as Transitions, World Tour, Heat Maps, Trees, Timelines and Sunbursts.
![]()
Follow Izenda on social media for the latest on technology and business intelligence:
![]()
![]()
![]()