A Simple Way to Do Percentage By Status

By | Tips

This view tells us the % of orders that use shipper 1 by employee.ย The ratio analysis divides a SUM by a COUNT of the same field and then uses a CAST to turn it into a percentage on a floating point scale.

CREATE VIEW OpenPercentage
SELECT LastName, CAST(SUM(CASE ShipVia 
WHEN 1 THEN 1 ELSE 0 END) 
AS FLOAT)/COUNT(ShipVia),COUNT(ShipVia) AS [Count]
FROM [dbo].[Orders]
JOIN [dbo].[Employees] 
ON [dbo].[Employees].[EmployeeID]=[dbo].[Orders].[EmployeeID]
GROUP BY LastName

Auto Shrink: Turn It Off!

By | For Developers, Tips
The Auto Shrink feature of SQL Server is designed to limit once precious storage space required by databases.ย  Since most modern systems tend to expand continuously and may go as far as marking records deleted rather than actually deleting them, there is little benefit to this feature anymore.ย Furthermore, with the price of a terabyte of data plunging, there is little economic value to saving the space. Read More

Advanced Record-Level Business Intelligence with Inner Queries

By | For Developers, Tips

While business intelligence is generally applied at an aggregate level to large data sets, it’s often useful to provide a more streamlined insight into an individual records or to be able to sort and rank them.ย For instance, a salesperson looking at a specific customer could benefit from basic stats on that account.ย A marketer trying to define an ideal customer could pull the top entries and look for insights or patterns.ย Inner queries let you do sophisticated analysis without the overhead of traditional BI or OLAP technologies like Analysis Services. Read More

Bull Sharks and Stored Procedures: Two Things to Avoid

By | For Developers, Tips

Sharks Explore by Biting Because They Are Nearly Blind

Bull shark
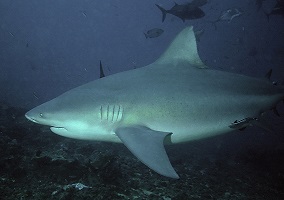
Many consider bull sharks to be one of the worldโ€™s deadliest creatures.ย Despite their awesome prowess and speed, bull sharks are nearly blind in the deep, dark waters of the ocean.ย Rather than identifying friend, foe and food by inspection, they literally bump into and bite things they are interested in to determine what they are.ย What if they bite into something bad like barrel of oil or one of the few creatures they canโ€™t defeat in a fight?ย There are consequences to this approach and the shark is really just hoping that the interesting object will behave well. Read More

Customizing Reports in Izenda Reports

By | For Developers, Tips
The majority of users wanted to create their own report with start by making tweaks to existing report before they create new ones from scratch. This article shows you examples on how to make a simple customization view in the Demo Report Viewer and a more advanced customization via the Report Designer. Weโ€™ll use a financial report based on orders in the Northwind sample database as an example. Read More

How to Have Great Dates (in Your Database)

By | For Developers, Tips

The Need for Date-Based Reports

One of the most effective ways to better understand an organization to visualize events over time to see how they are trending and how they compare to one another. Hereโ€™s an example that illustrates a multi-year comparison. This could be used to tell a story of what has happened and help decide a plan of action.

Trend chart

Order data from the Northwind database.

The Challenges of Reporting From Existing Databases

Most databases are optimized for quickly saving and retrieving individual records that drive an application. This can create some challenges when it comes to reporting in a way that delivers insight into the data. Now there are many complex technologies like ETL data warehousing and analysis cubes that try to solve this problem, but often require far more effort and overhead than itโ€™s worth. Many of the things these complex tools do can actually be done with a simple view. Read More

A Faster and Simpler Method for Adding an โ€œOtherโ€ Row to a Top 5 Query

By | For Developers, Tips

In Part 1, we used UNION to combine multiple queries in order to create a view for a Executive Dashboards. It displayed the top five countries as well as an additional row to give you some context by adding up the rest of the countries. In Part 2 of this article, we will use a CASE statement to do a logical transformation of the Country field in order to get the same result. Read More

Three Ways to an Excel File

By | For Developers, Tips

We often see situations where different members of the user community will need different ways to do the same thing.ย One example is generating an Excel (or CSV) file.ย While it would initially seem that this is a single feature, there are myriad different reasons for someone to do this.ย Salesforce.com, for instance, gives you three different interfaces that essentially do the same thing but are optimized for different situations.ย Software applications that require advanced reporting and data exports would be wise to follow their example.ย Here are the three main reasons users generate Excel or CSV files: Read More

Adding an โ€œOtherโ€ Row to a Top 5 Query for Executive Dashboards

By | For Developers, Tips
Sometimes implementing relatively simple ideas requires a surprising amountย of creativity. The pieย chart in Izenda has a simpleย option to combine smaller pie slices into a single slice. If you have twenty countries, but many are very small, the chart will look a bit cluttered. Theย tiny slices distract from the overall message without giving a lot of meaning.

We recently added the ability to combine the bottom slices into a singleย “Other” slice. This worked so well that a customer wanted to use it for manyย other parts of their system. Now, our “Other” feature works well for a pie chartย because there are a very small number of slices anyway. We needed somethingย that could work on billions of records and quickly summarize the top 5ย countries, while also giving the sum of all remaining countries as a singleย row.

Read More

High Performance Custom Fields for Multi-Tenant SaaS Architectures

By | For Developers, Tips
This article shows a simple way to give applications with multi-tenant architectures the ability to add custom fields while keeping the performance, type safety and reporting capabilities of the relational model and SQL language.

SaaS Takes Over the ASP Model

In the late 90’s application service providers started leveraging the availability of abundant bandwidth and the popularity of the web to deliver applications in an ASP model. Essentially the application would be hosted on a shared server and managed by the ASP.ย  While this was a step in the right direction, there were still significant challenges with this approach.ย  These models evolved into what is now knows as Software as a Service or SaaS.ย SaaS architectures introduced multi-tenancy which allowed pools of high powered resources to be shared in a different way.ย  Rather than customers having their own web server and database, a shared infrastructure served dozens or sometimes thousands of customers. Read More