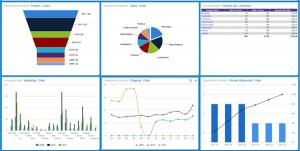
Denver, CO – June 12, 2012 – Open Scan® Technologies, Inc. announced today their partnership with Izenda, a leader in business intelligence. Open Scan’s Accounts Receivable and Accounts Payable Process Management solution users will benefit from greater insights into their financial supply chain data.
“It’s wonderful seeing HTML 5 technologies used in the financial sector to deliver embedded business intelligence,” said Izenda CEO & Chief Architect, Sanjay Bhatia. “Giving users access to real time data can create significant operational efficiencies that give organizations an edge.”
Izenda is a true ad hoc reporting solution that allows users to create reports on the fly without the need for IT or an understanding of underlying database architecture.
“We are excited to partner with Izenda to deliver world class reporting and dashboard capabilities,” said Open Scan® CEO Nadine Lange. “This will provide our clients insight into their financial data.”
About Izenda
Izenda is the market leader in Embedded Business Intelligence for business applications built on the Microsoft platform. The privately held Atlanta-based software company has delivered ad-hoc reporting, real-time dashboards and data visualizations to over one million users by embedding into over one thousand applications. Founded in 2002, the company applies agile software principles and HTML5 technology to give organizations better insight into their data. www.izenda.com.
About Open Scan
For more than a decade, Open Scan® Technologies Inc. has revolutionized enterprise financial workflows with industry-defining product innovations in payment capture, remittance processing, cash application, payables, and deduction management. Corporations, financial institutions, and government agencies realize unrivaled performance and efficiency as well as measurable savings and increased accuracy of data. www.openscan.com
Contact Information
Open Scan Technologies, Inc.
Ryan Stoops
Marketing Manager
303.867.7410
rstoops@openscan.com


 Your users have pushed for better dashboards and self-service functionality. They’ve tried working with their own IT for new dashboard designs. They may push your organization for dashboards with more impactful reports and data visualizations. Neither option is scalable.
 How much of your time do you spend writing custom reports? Probably too much. It isn’t what you signed up for when you decided you wanted to be a developer. Well, leave the reporting to the end users with a self-service business intelligence platform, and start looking at other things that are much more interesting. Here are some topics to look into for 2016.
 Just as you were getting used to virtual machines, the next big thing is here. Containerization of applications is the next logical step in containerizing web applications and operating systems for massively scaled distribution. Confused yet? Let’s take a look at how Docker works in comparison to a typical virtual machine and the advantages that it provides.