Beta Report Designer
Overview
With Izenda’s latest report designer, the aim has been to simplify the report designer experience to empower the average citizen user to derive insight from their data. To achieve this goal, the new report designer features a step-driven process that walks a user through the creation process from data selection to sharing and distribution.
As a result of this new approach, the report design process is broken into three main ares: Report Part Design, Layout Design, and Distribution (Permission and Sharing)
Report Part Designer
The first section, Report Part Design, is dived into three sub-steps:
- Select Your Data
- On the left-hand side is a list of every data connection that your user has access to for report design
- In the center of the screen is a list of all data fields your user can access separated by the underlying database object (table, view, etc.)
- On the right-hand side is a list of all of the report parts your user has created. Each report part can contain a unique set of fields for display.
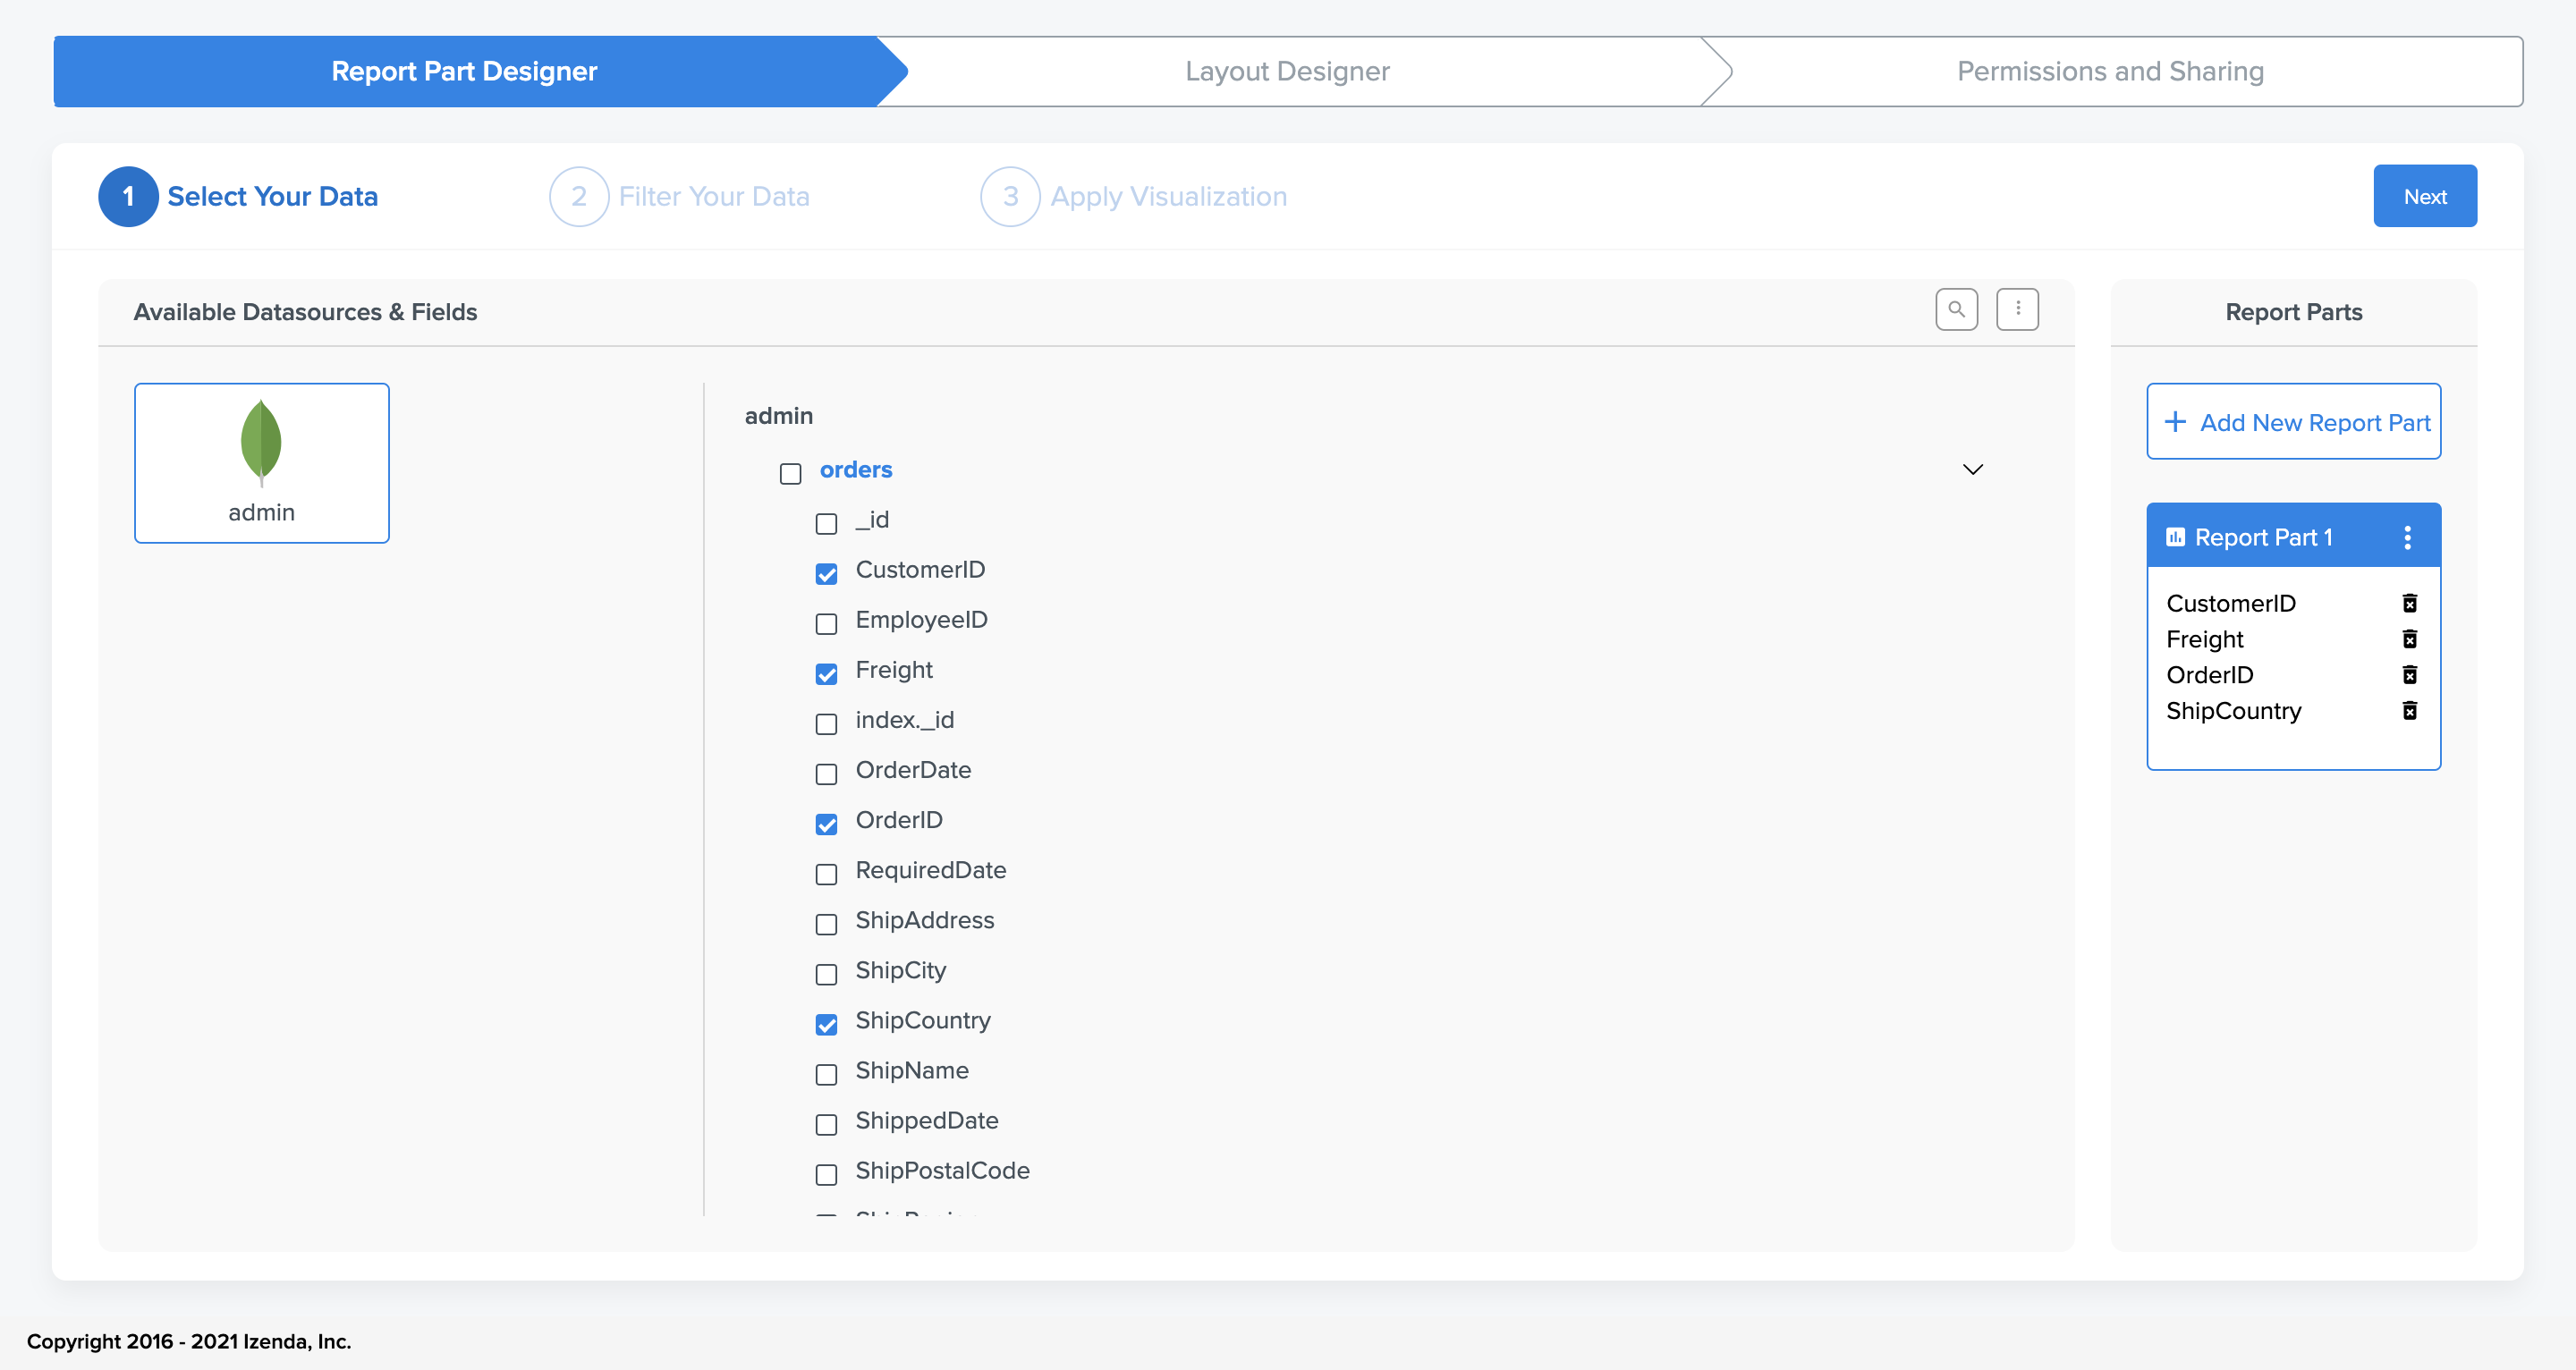
- By selecting a database object and any field, that item will be added to their selected report part
- In order to streamline this process, your data sources may be disabled after a field has been chosen. After a field selection is made, users will be limited to only sources with an underlying relationship to that field in the data model.
- During this step a user can create and populate as many report parts as they need for their report
Filter Your Data
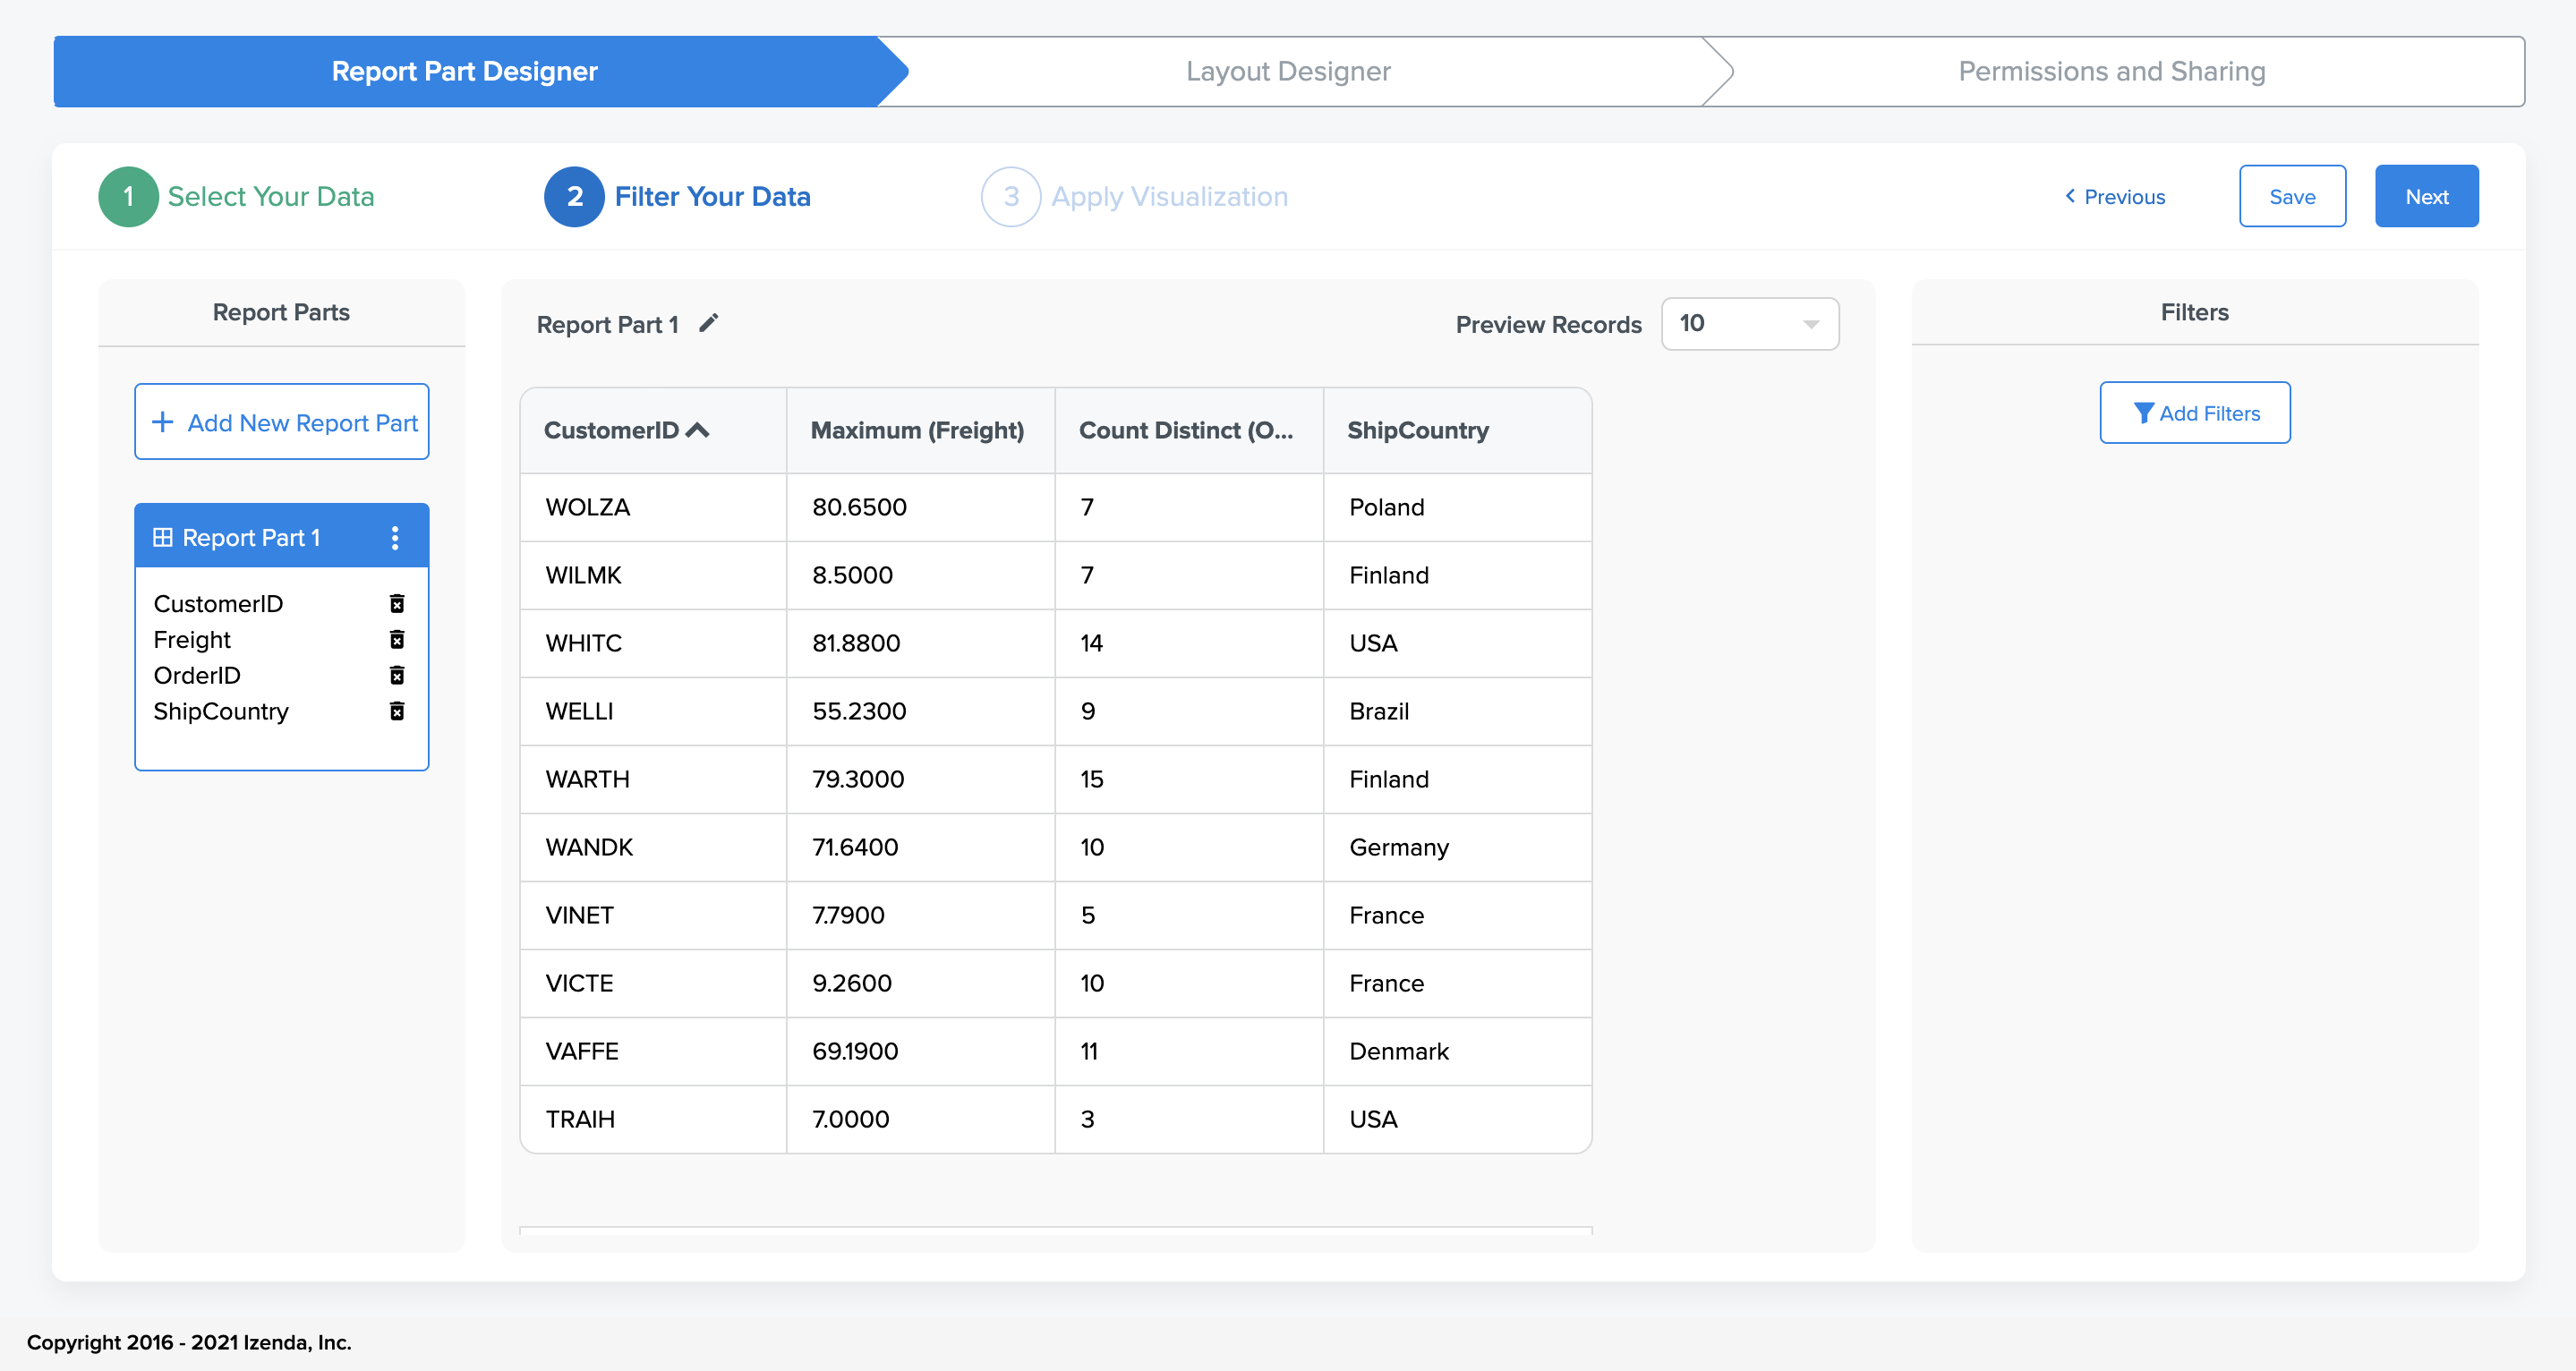
- After a user has populated the data for their desired report part(s), this page will let them view the data for each report part in a grid fashion
- During this step users can interact with the grid itself in order to apply functions, formats, or sorting.
- Additionally, along the right-hand side of the screen users can click ‘Add Filter’ to open a modeal for filter creation

- As part of this modal a user is able to specify fitlers to be added for this report as a whole. Additionally, report creators can specify how end-users should input filter values from the report viewer.
- Apply Visualization
- During this step, users can select their desired visualization from the right-hand Visuals panel
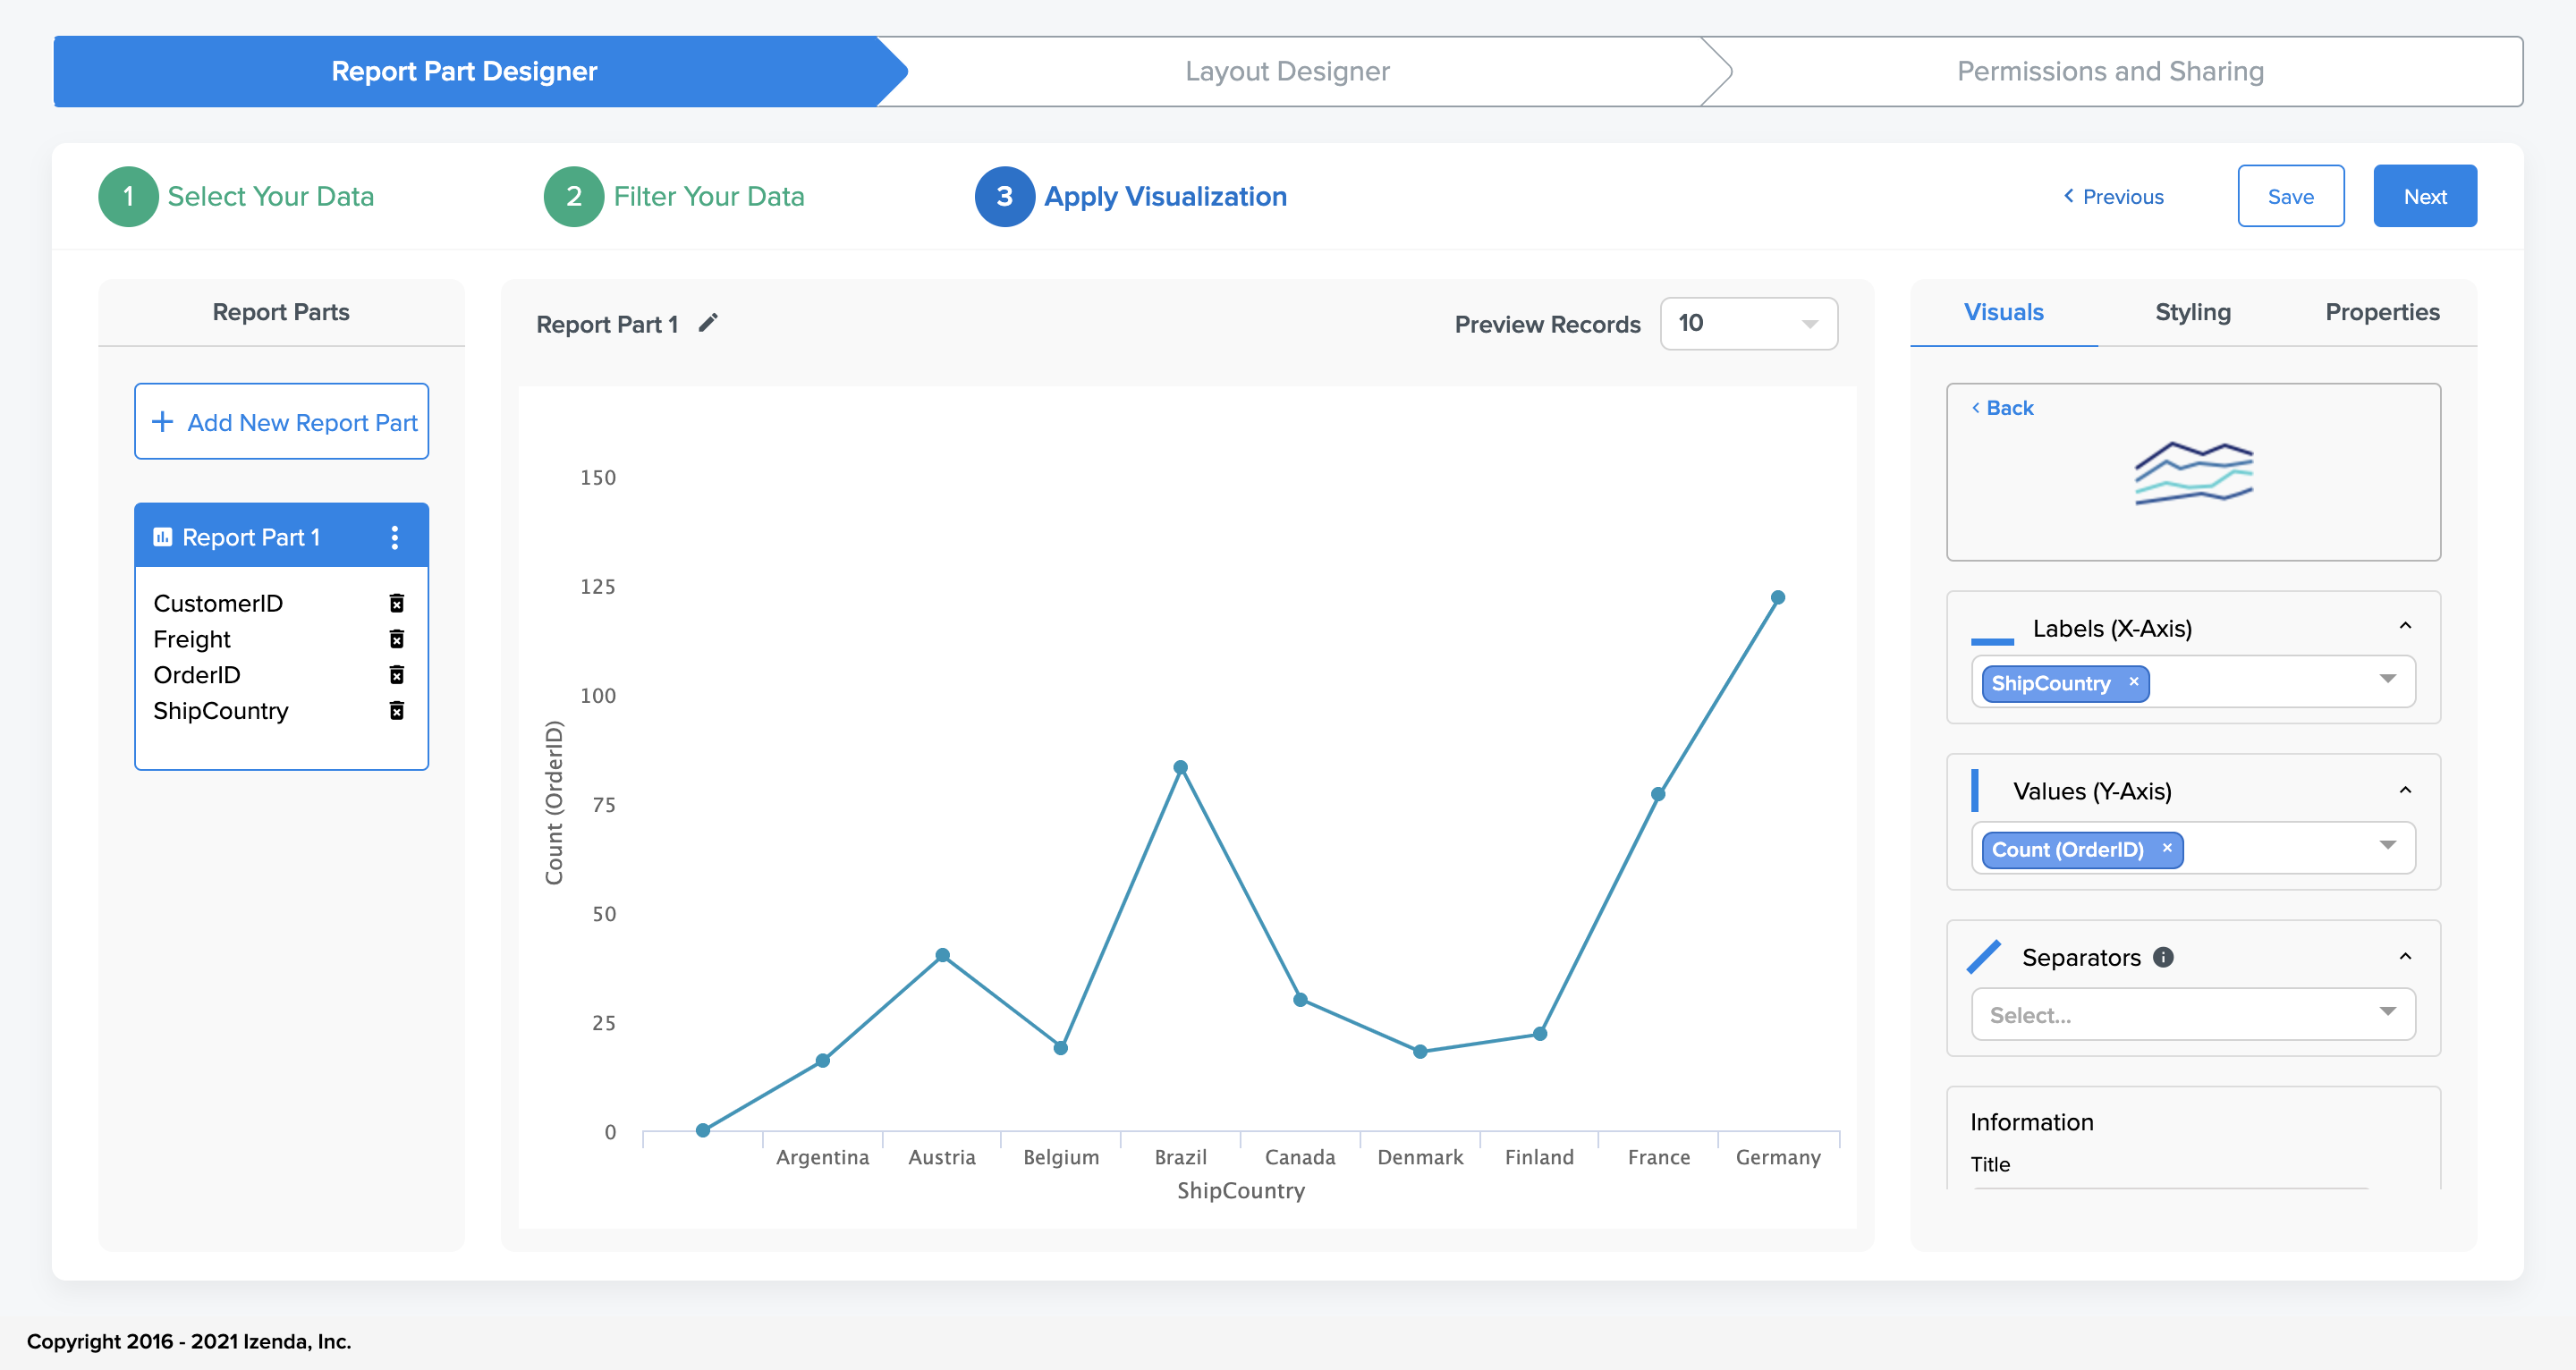
After selecting this visualization, the Visuals tab will adjust to show users where fields need to be specified in order to generate that particular visualization.
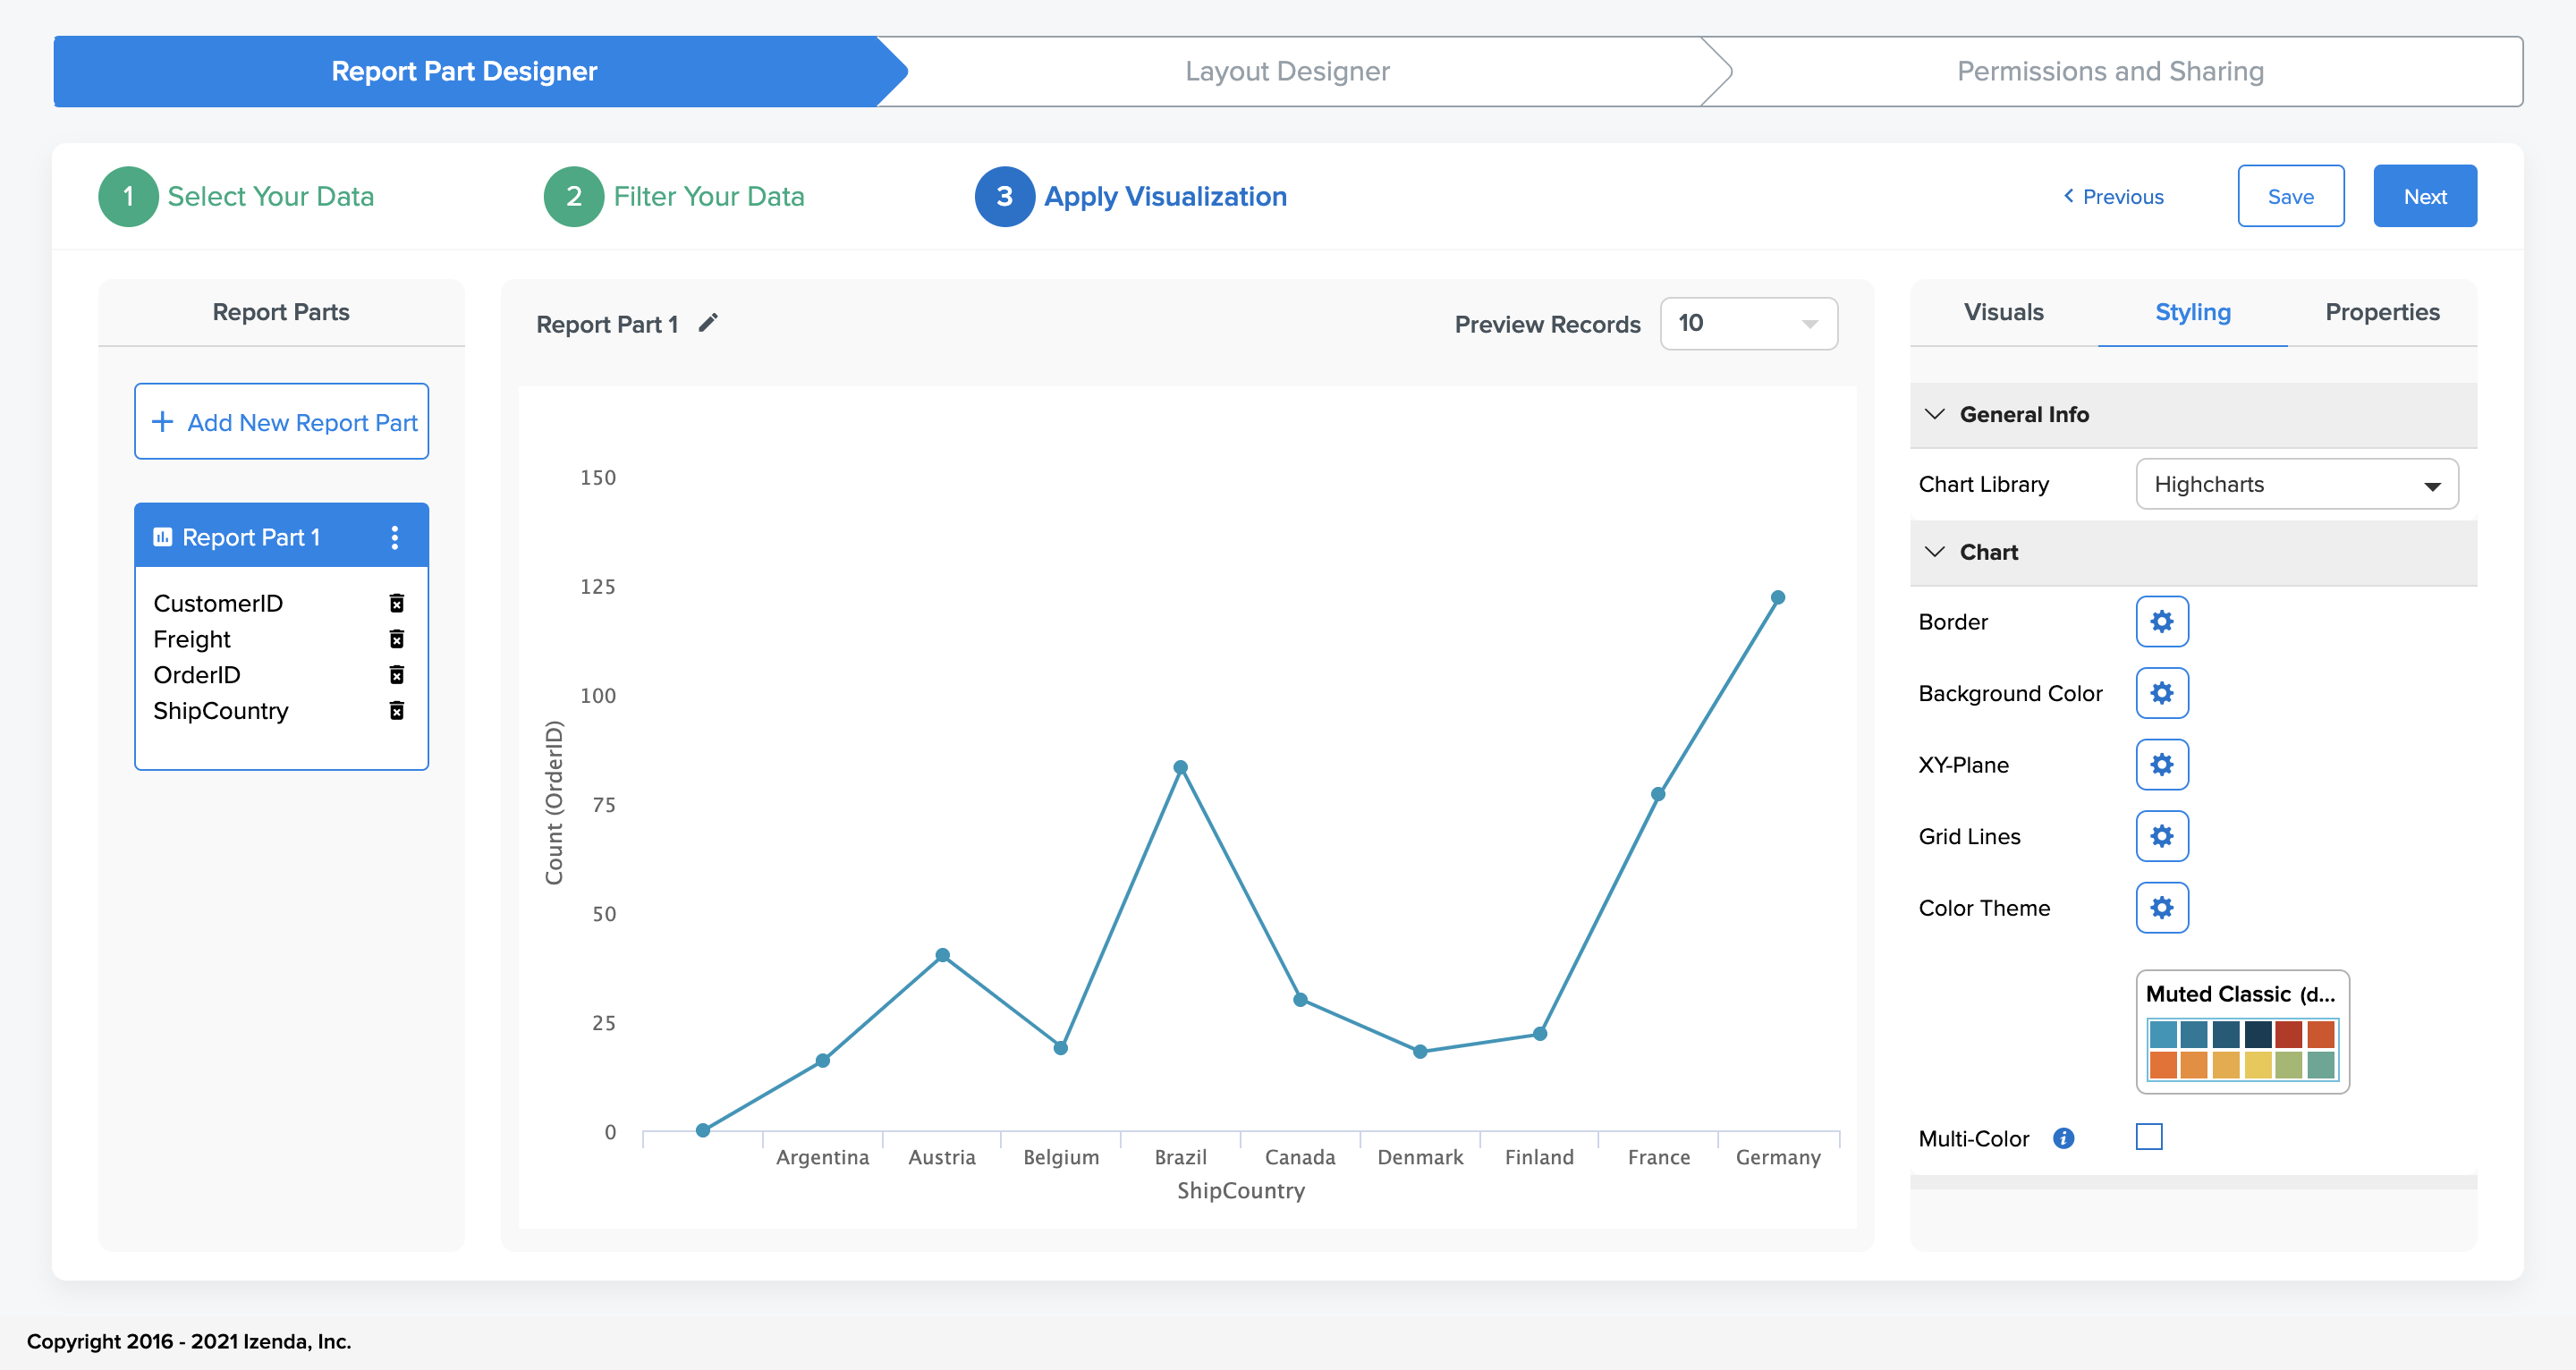
- The right-hand panel also contains the Styling and Properties panels
- The Styling panel represents all of the options that configure or impact the aesthetic portions of the report
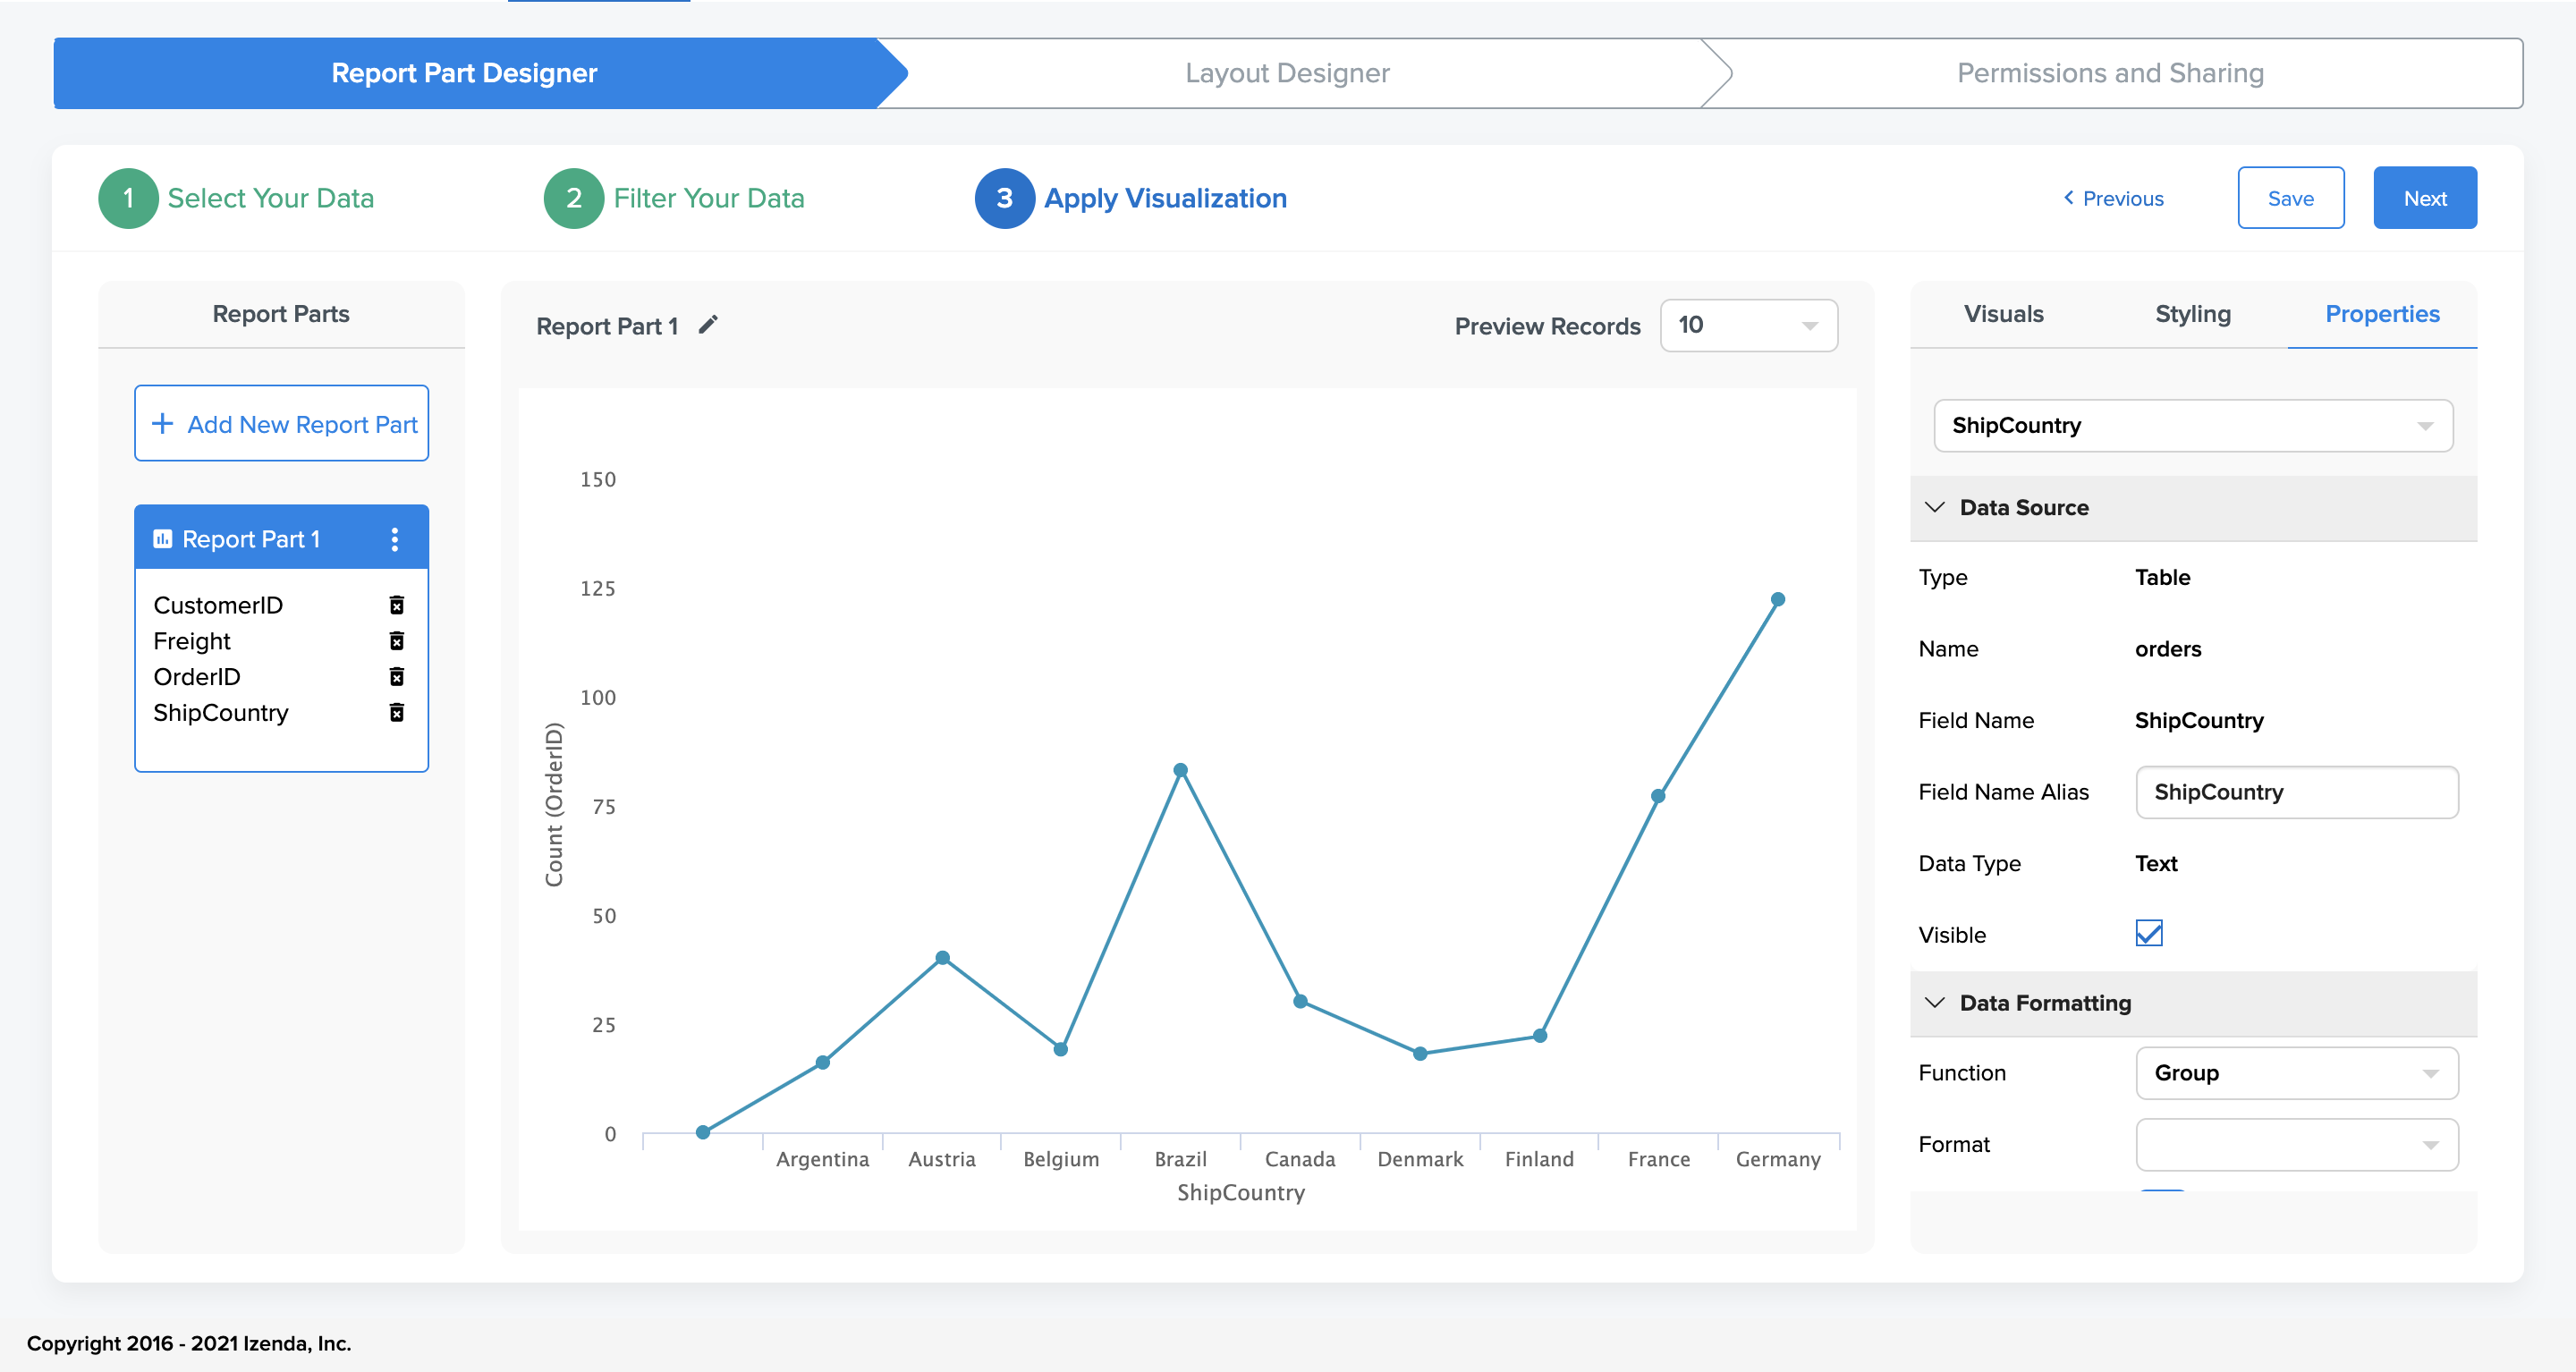
- The Properties panel allows users to configure field-level options, such as aggregations and formats for unique data points
Layout Designer
The second section, Layout Design, is comprised of one central screen. This step is intended to allow users to control the layout of their report part contnet and to choose specific sizes and positions for their visualizations.
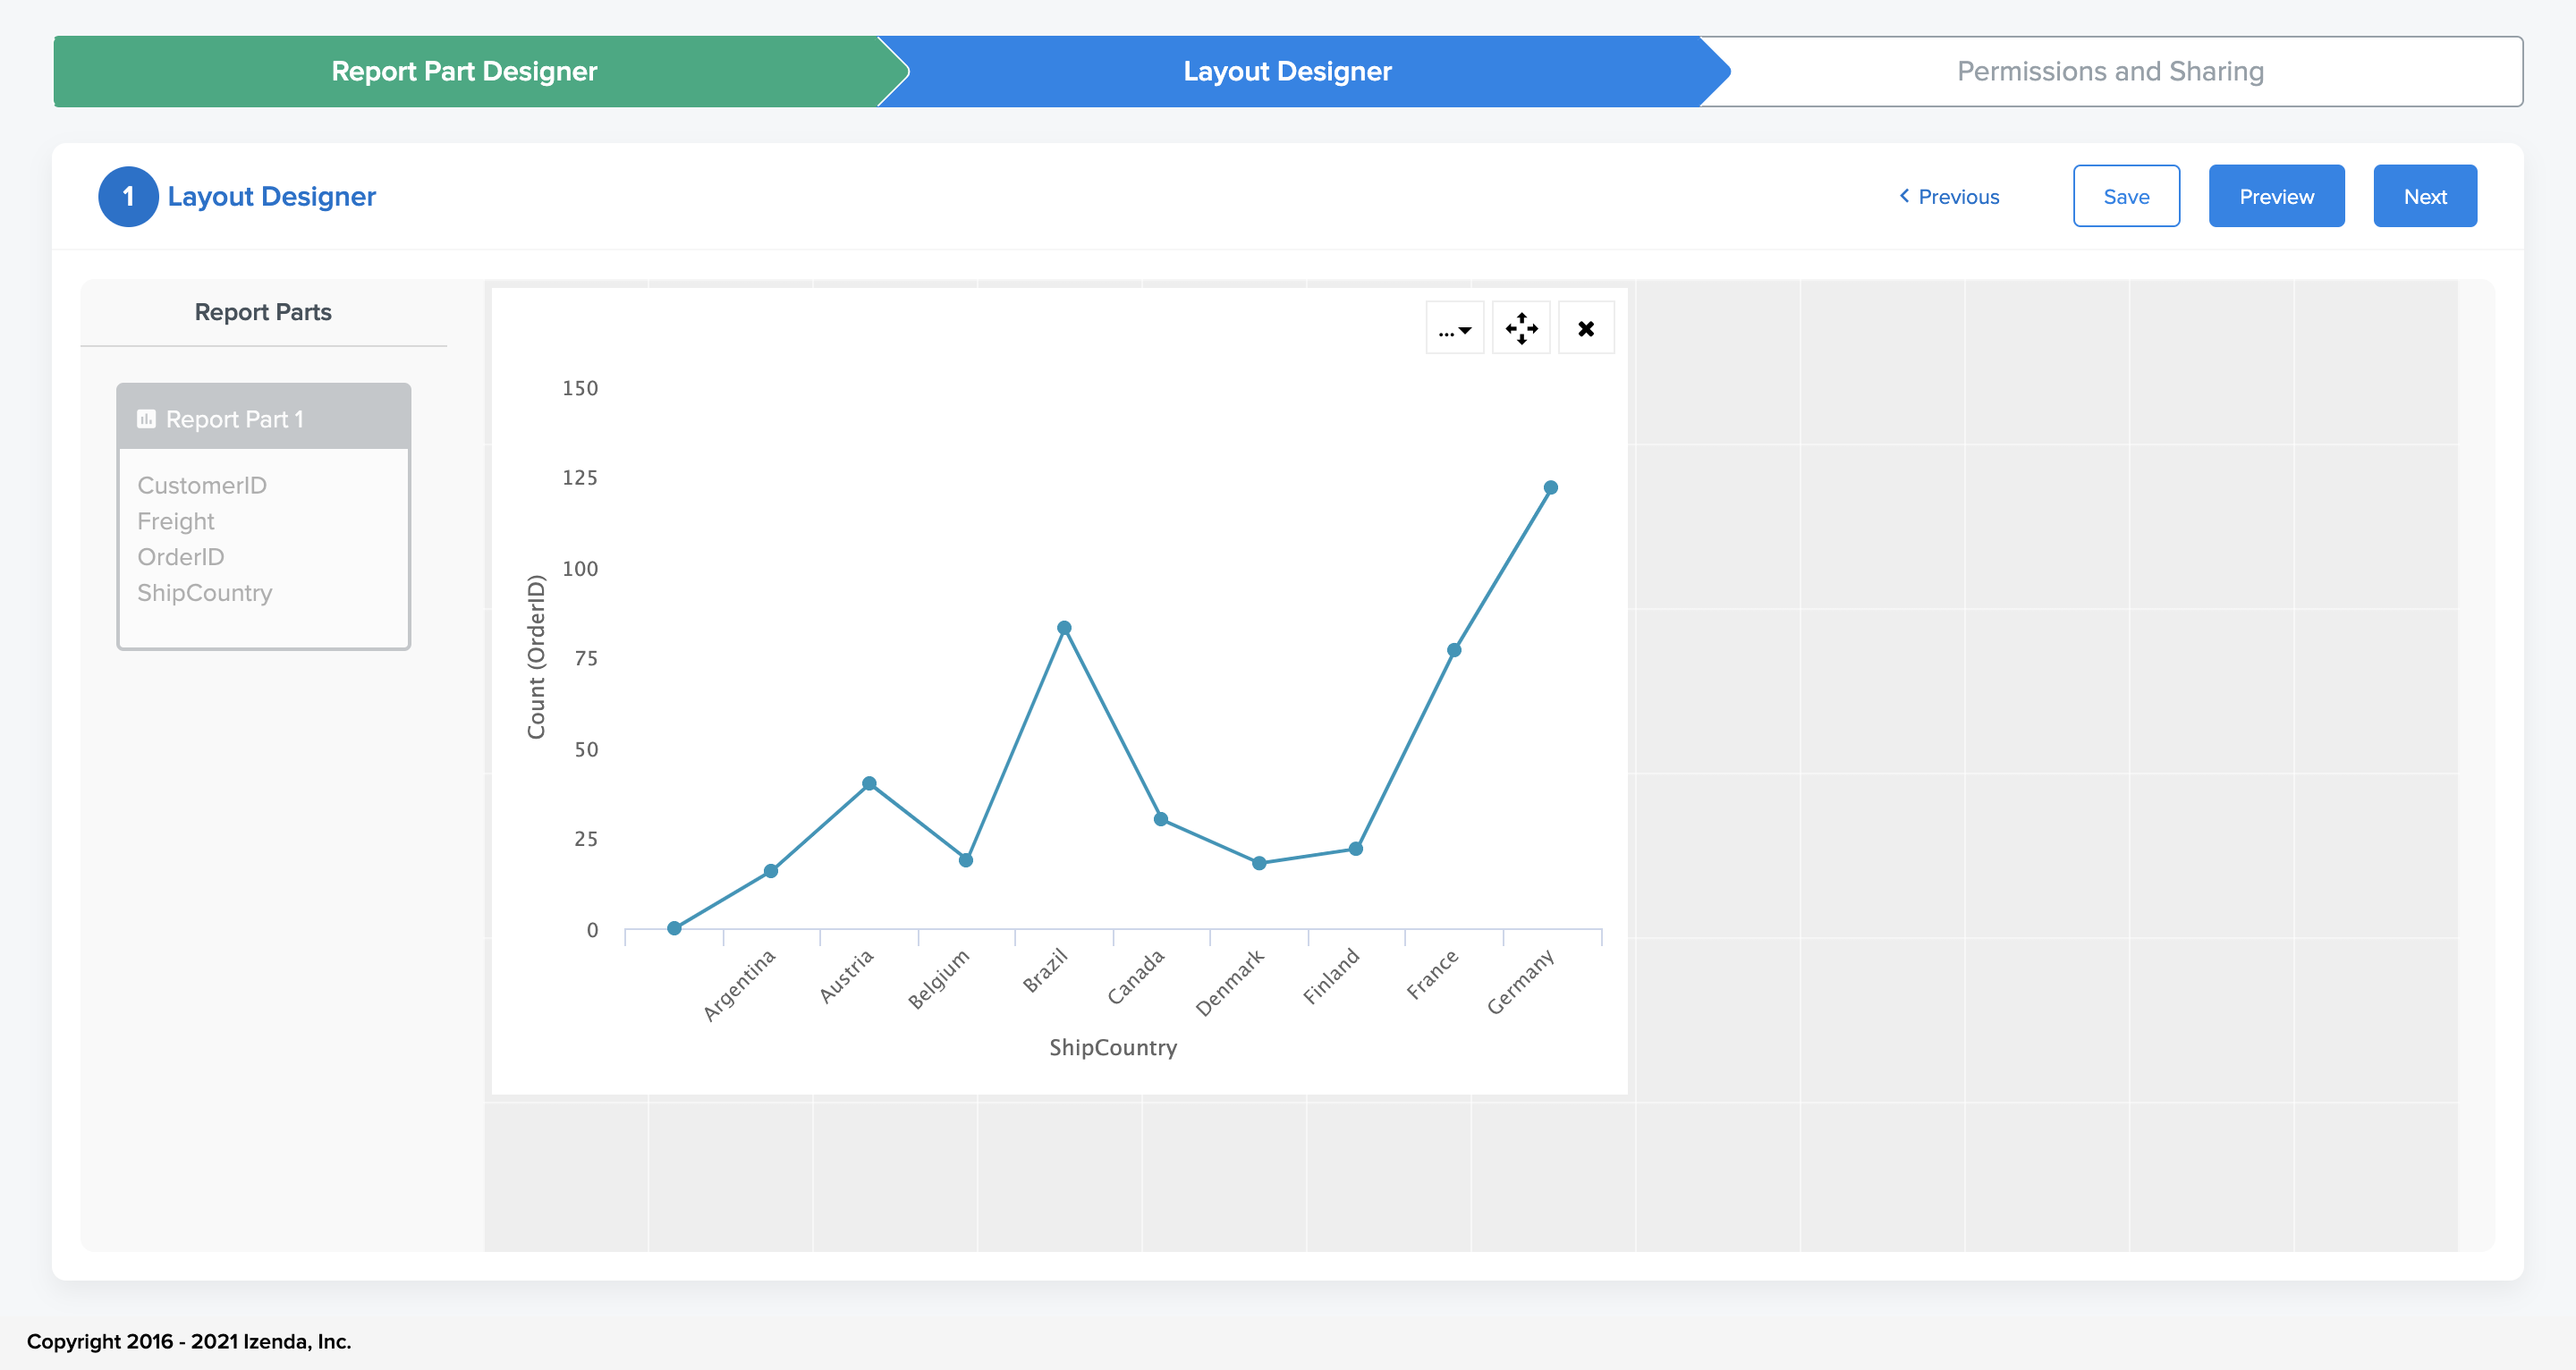
- By clicking on any blank grid cell, a user can choose which report part to place in the grid
- Each tile can be resized and repositioned as needed
- If only one report part is present in the report it will be added automatically when a user clicks on the grid
- At the top right of the page is a button labeled ‘Preview’ that will allow a user to see how their report looks from the report viewer.
- Please note that some changes may need to be saved prior to previewing the report in order to see the report content accurately
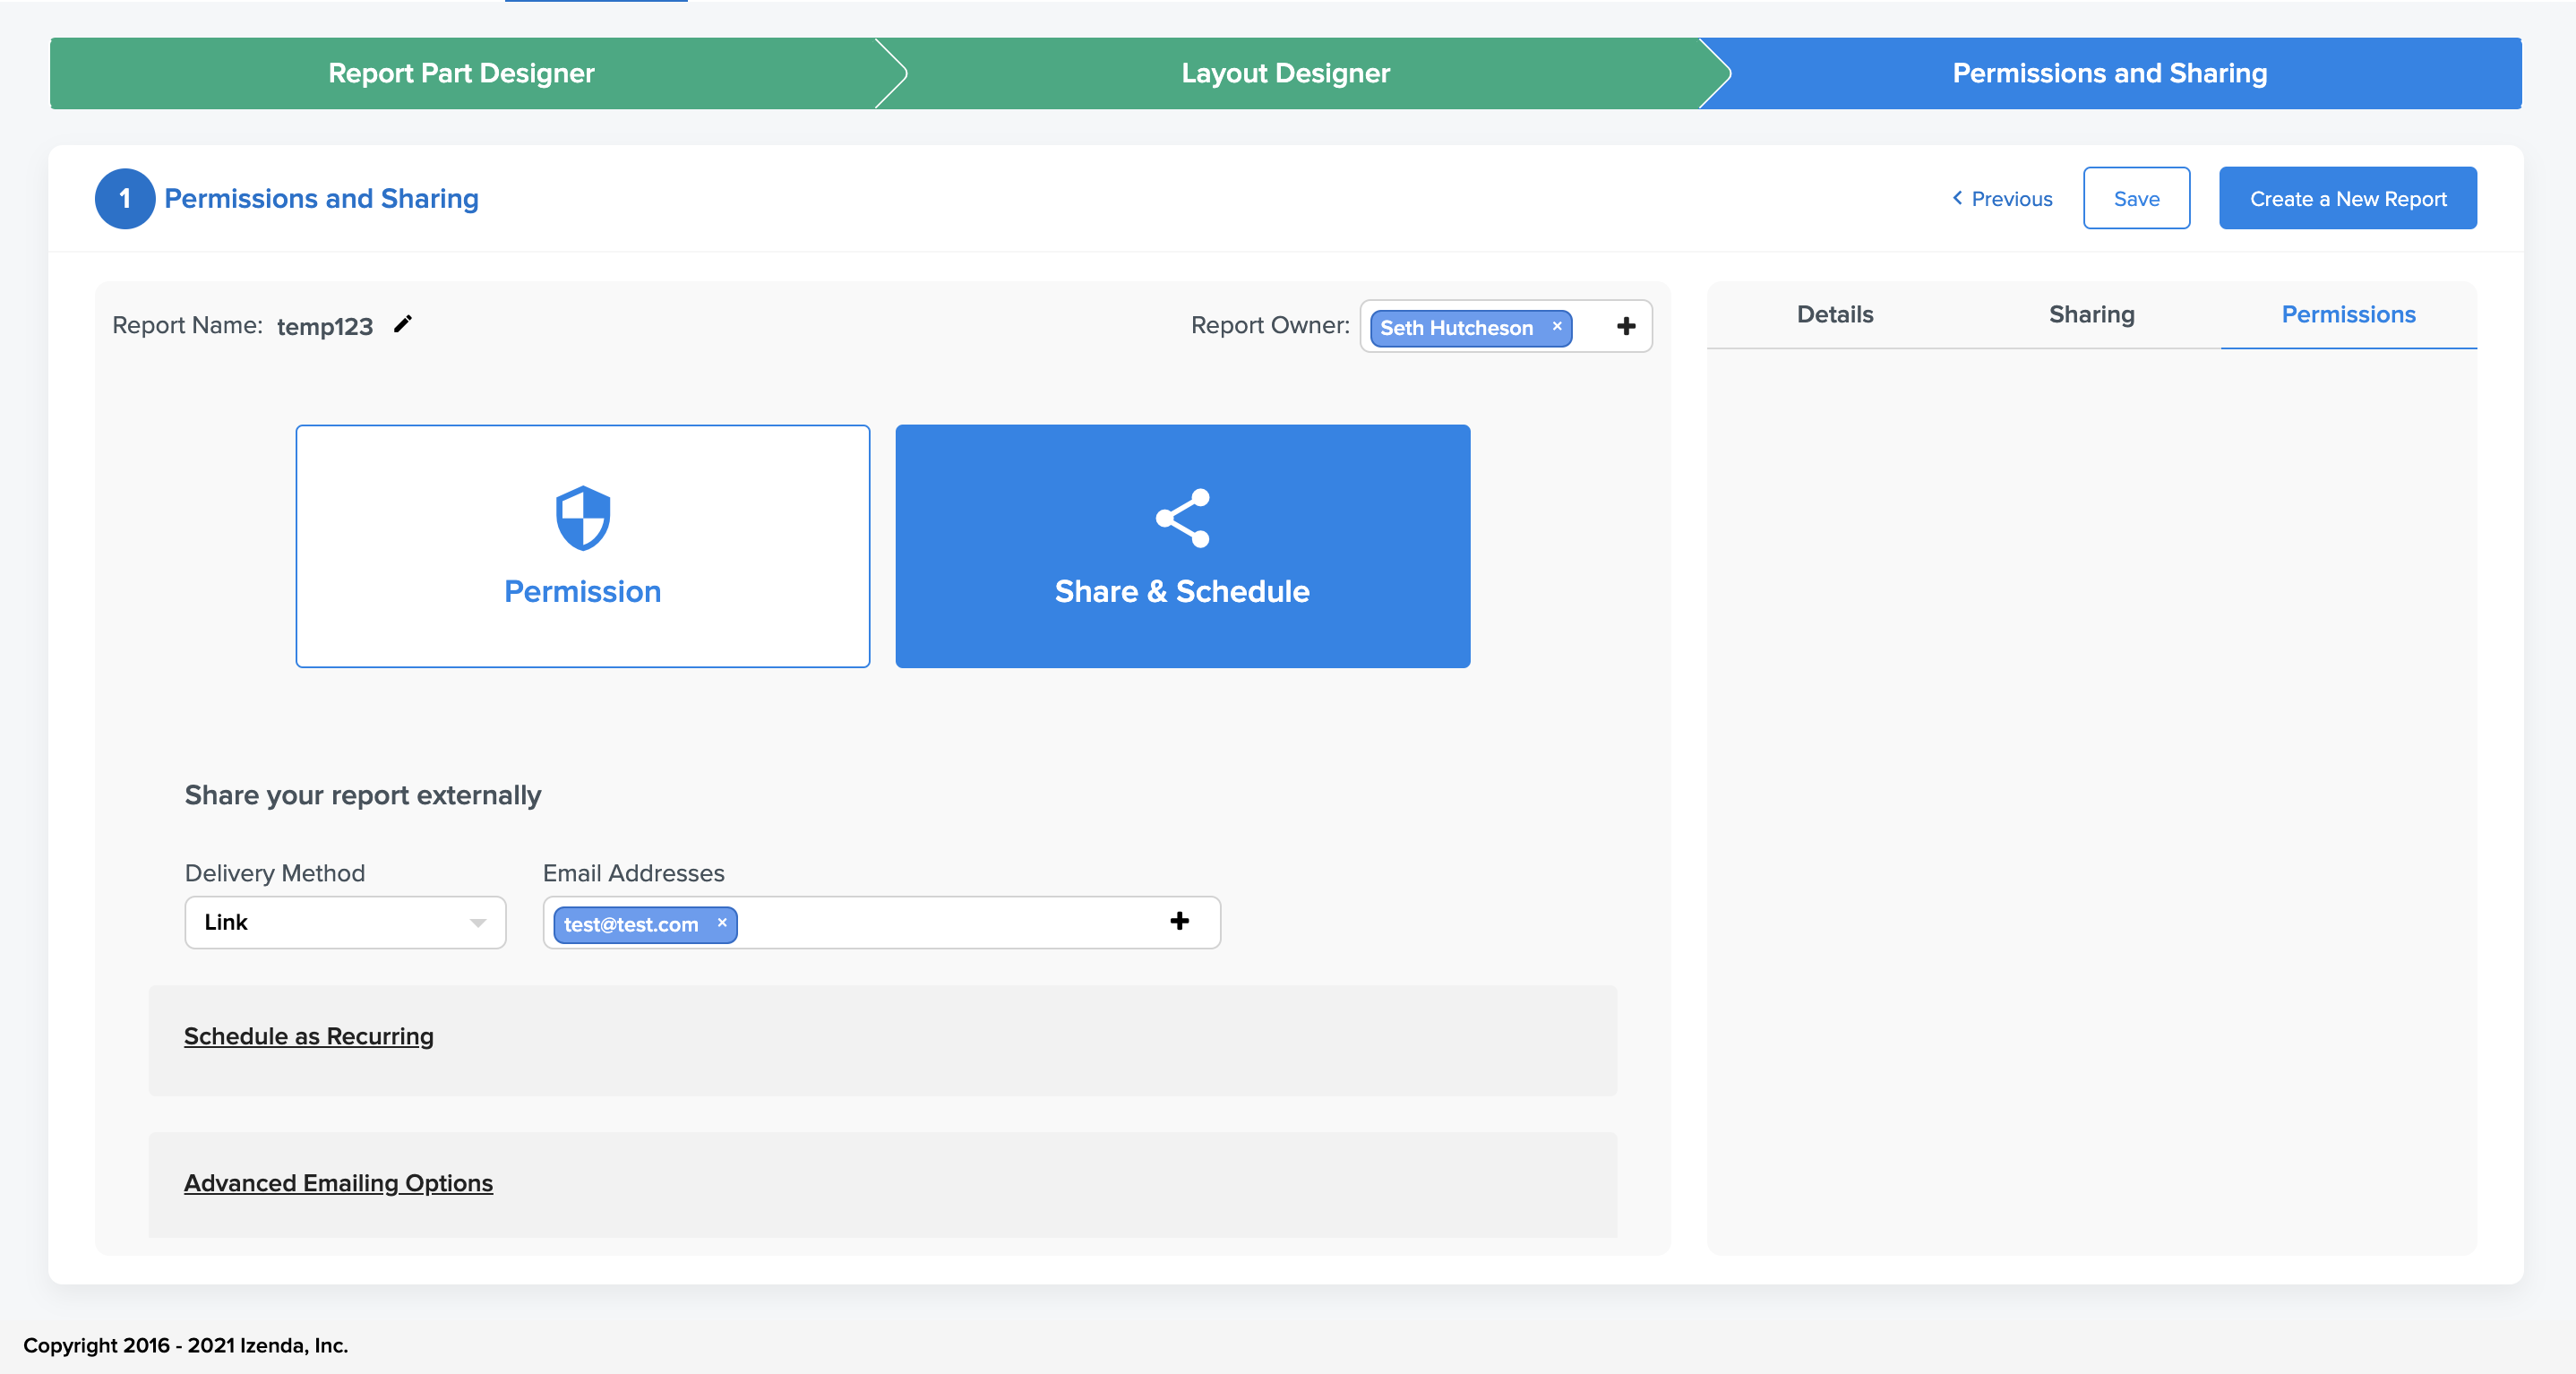
Permissions and Sharing
The third section, Permissions and Sharing, is comprised of one central screen divided into two workflows.
The first workflow is for configuring Permissions on the report.
- These options will control how users are able to access the report and the extent to which they can edit or alter it.
- The impact these have to the report mirror the permissions that can be set on legacy reports
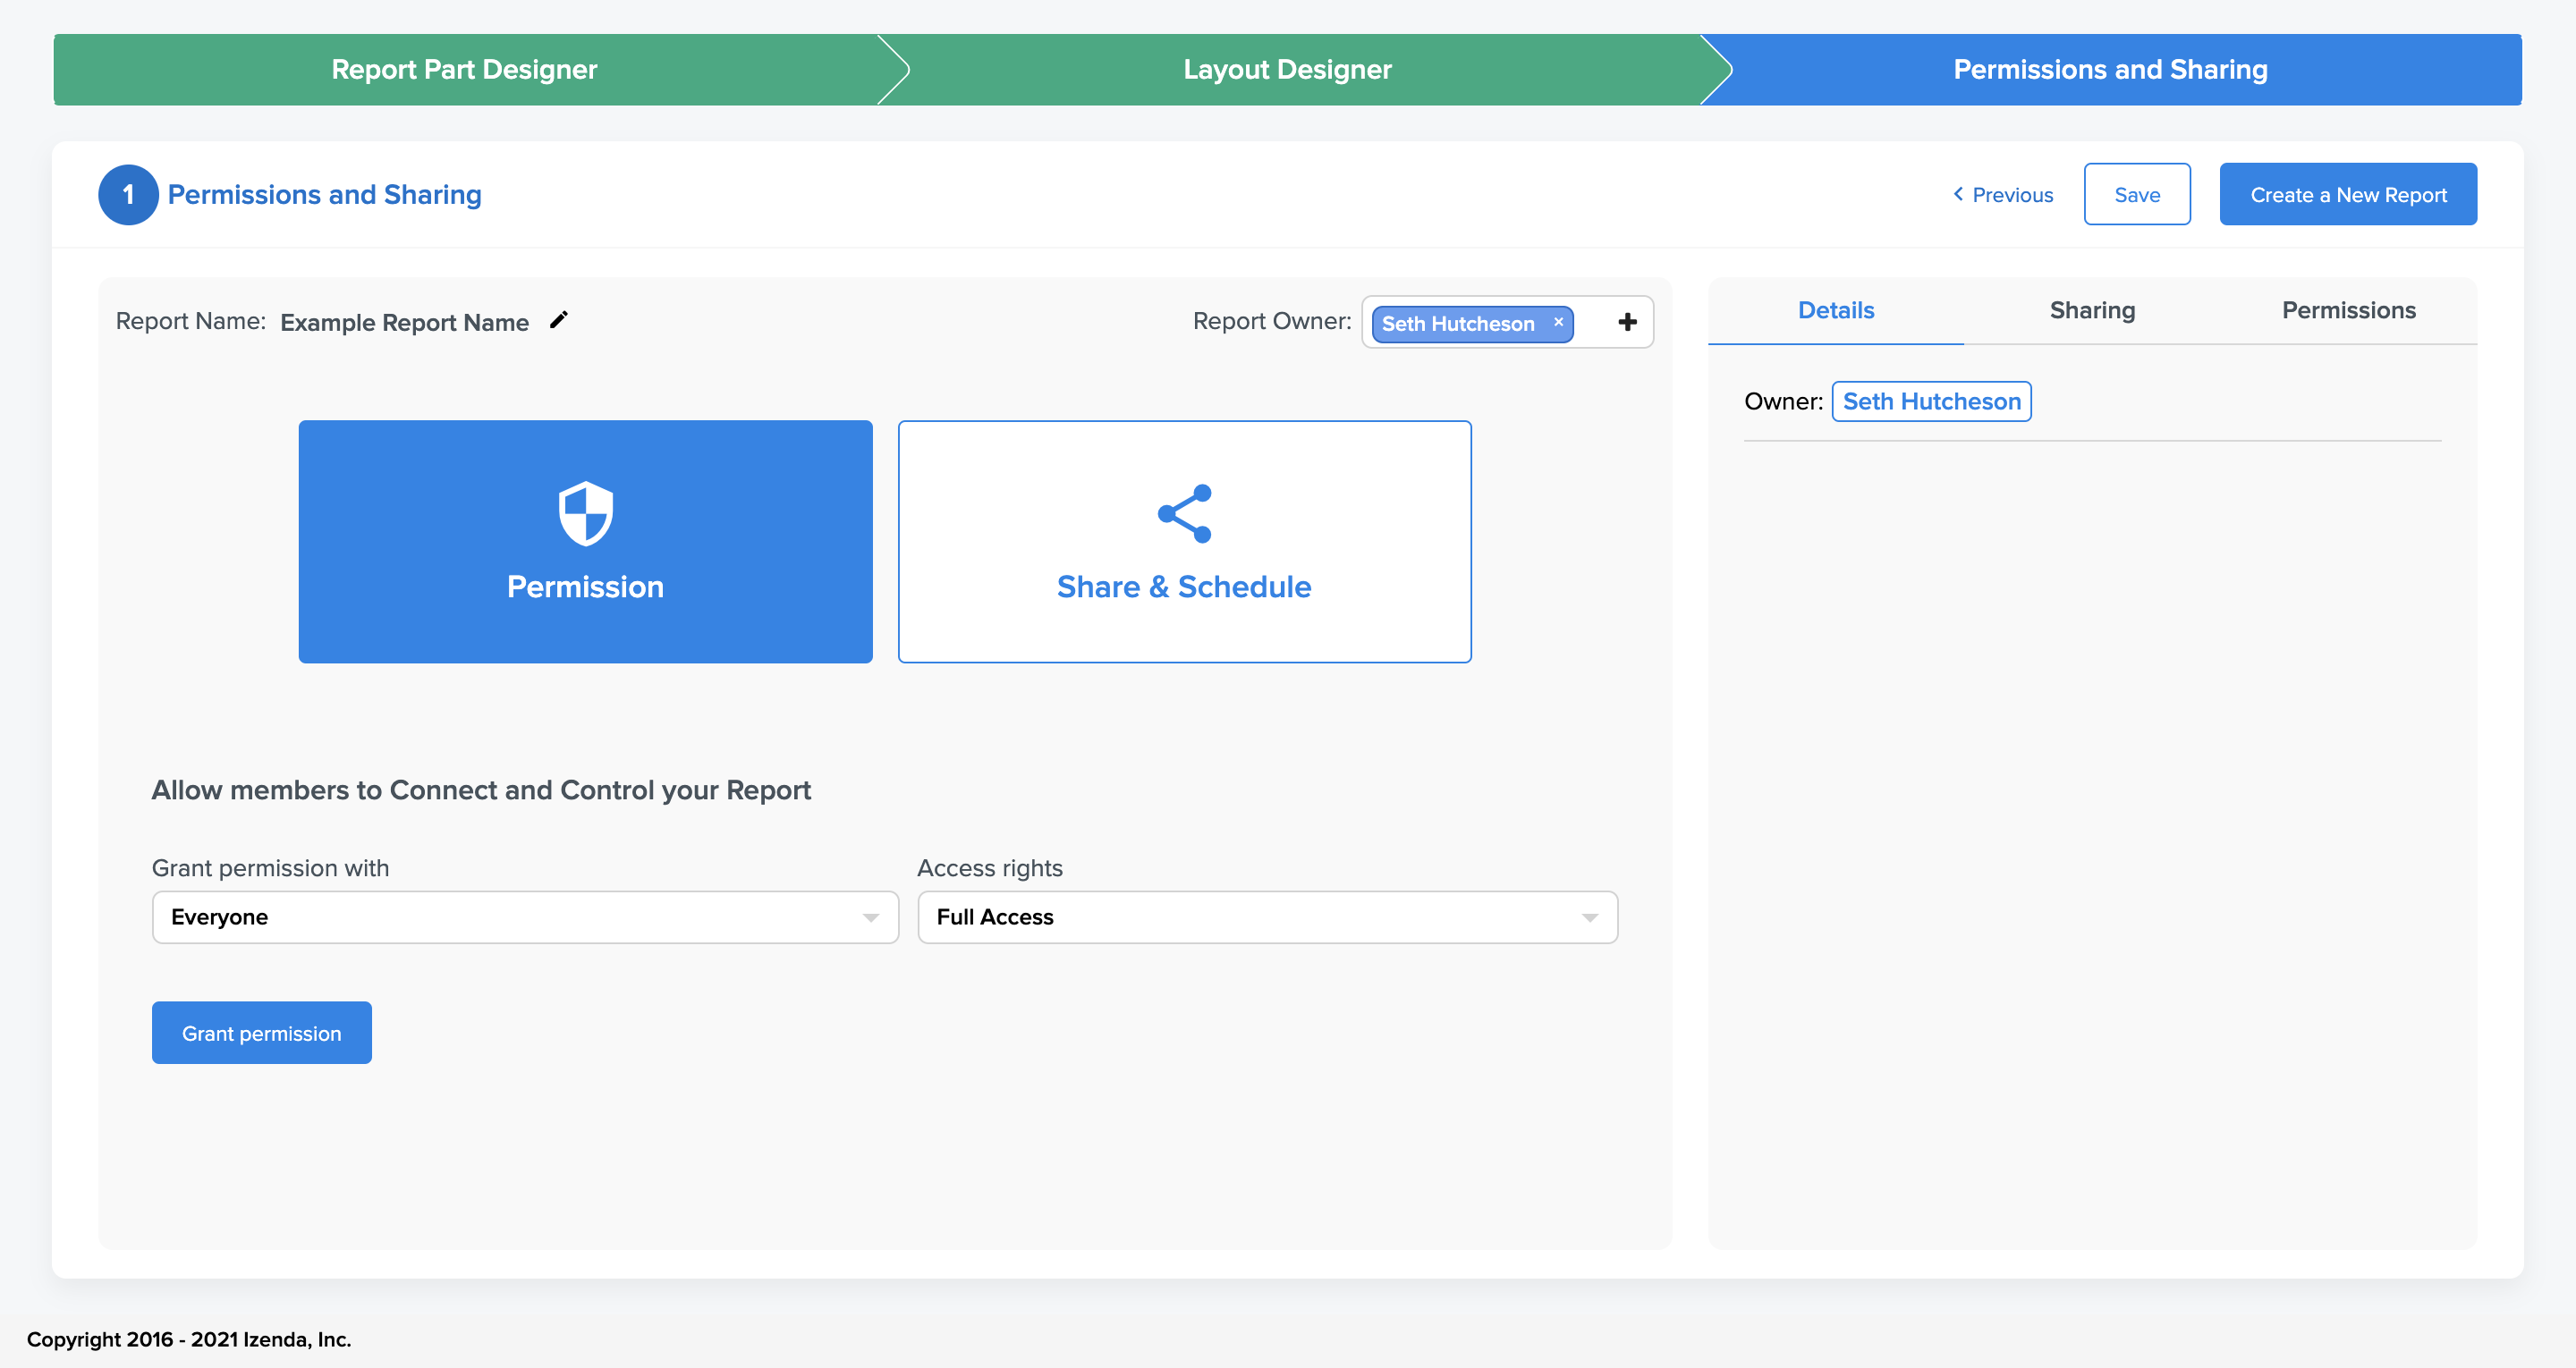
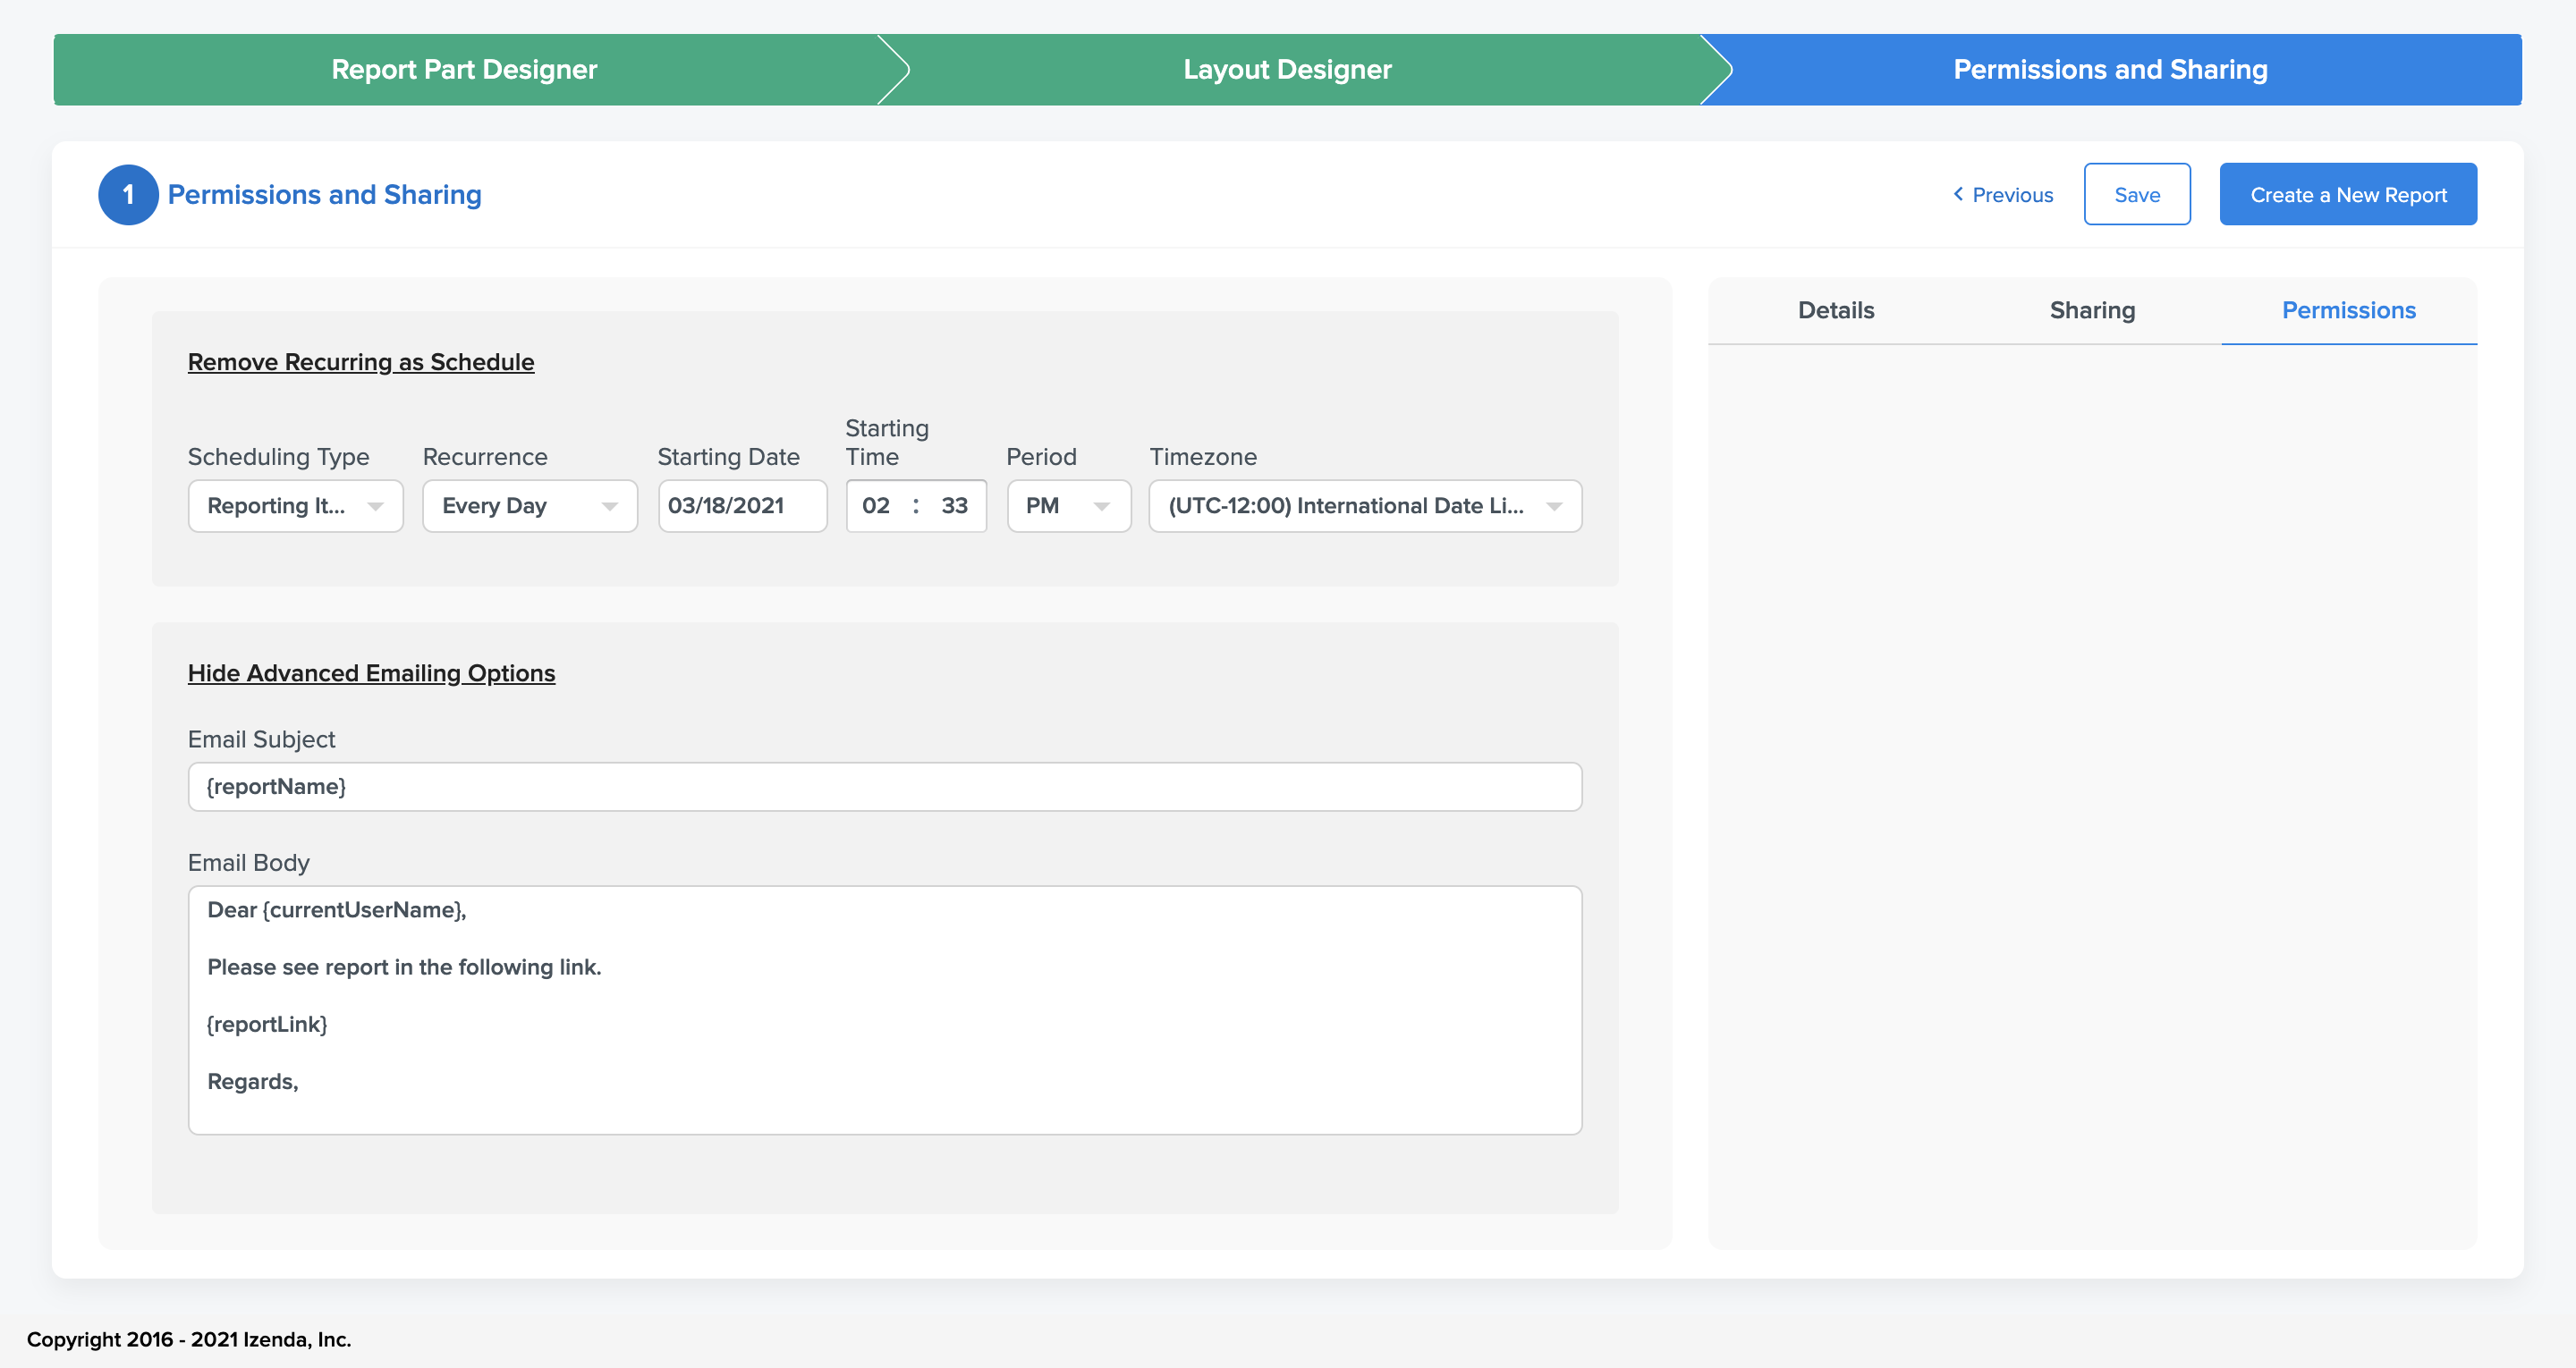
The second workflow is for configuring email and schedule items for the report.
- Through this flow a user can send one-off email events or configure recurring deliveries to specified recipients
- Please note that in order to deliver either of these the report must be saved prior to the configuration
Each item comes with the ability to modify the email body and subject so that the delivered content can be customized for each delivery.