We’ve launched Izenda version 6.8, a new update with a lot of great new features that will help users better understand and envision their data.
Introducing the New Izenda Vision Module
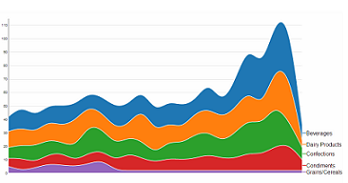
Users can also select a chart format for their report even more easily, using our one-click visualization functionality. Hover over the smart bar to choose the color palette, chart style and metric. Instantly update data by clicking on a visualization. Version 6.8 also has new Auto Chart functionality, which lets users explore data visually, instantly transforming their reports into different chart styles.
Other new features in Izenda Reports include:
- Easier integration with HTML5 applications
- Support for the latest browsers and Jquery framework
- Core chart types in the Report Designer with a new, modernized look
- Enhanced responsive design in grid, charts, toolbars and breadcrumb trails for better mobile viewing
- Open and simplified CSS for streamlined integration
- High performance bulk CSV implementation functioning as a streaming operation
- Additional Foreign Language Pack enhancements
- Multiple Data Source Aliases for complex joins
- Secondary keys for advanced drill-downs
You can request a demo with a product expert, or download the newest release from the website.