Release Details
v4.0.0 (Beta) Major Release – March 24th, 2021
Breaking Changes
- Front-end Updates
- React upgraded from 15.6 to 16.3 - React 15 to 16 migration guide
- React-dom upgraded from 15.6 to 16.3
- Mobx upgraded from 2.4.2 to 5.15
- Mobx-react upgraded from 3.5 to 5.2
- Bootstrap upgraded from 3.3.7 to 3.4.1
- Babel upgraded from 6 to 7
- .Net Core 3.1
- Newtonsoft.Json - 12.0.1
- Log4Net - 2.0.12
- Exporting Engine
- Izenda has updated the exporting process from WebKit to the Blink Engine
- Map Provisioning Changes
- The Izenda data structure for mapping data points has been updated for better performance, so map data must be re-provisioned within your Izenda instance
- Encryption Changes
- Izenda’s encryption algorithm has been updated from 128 bit to 256 bit to support FIPS compliance
- Excel Driver
- Izenda has internalized the Excel driver and as a result, some pre-existing reports may be impacted by this change
FEATURES
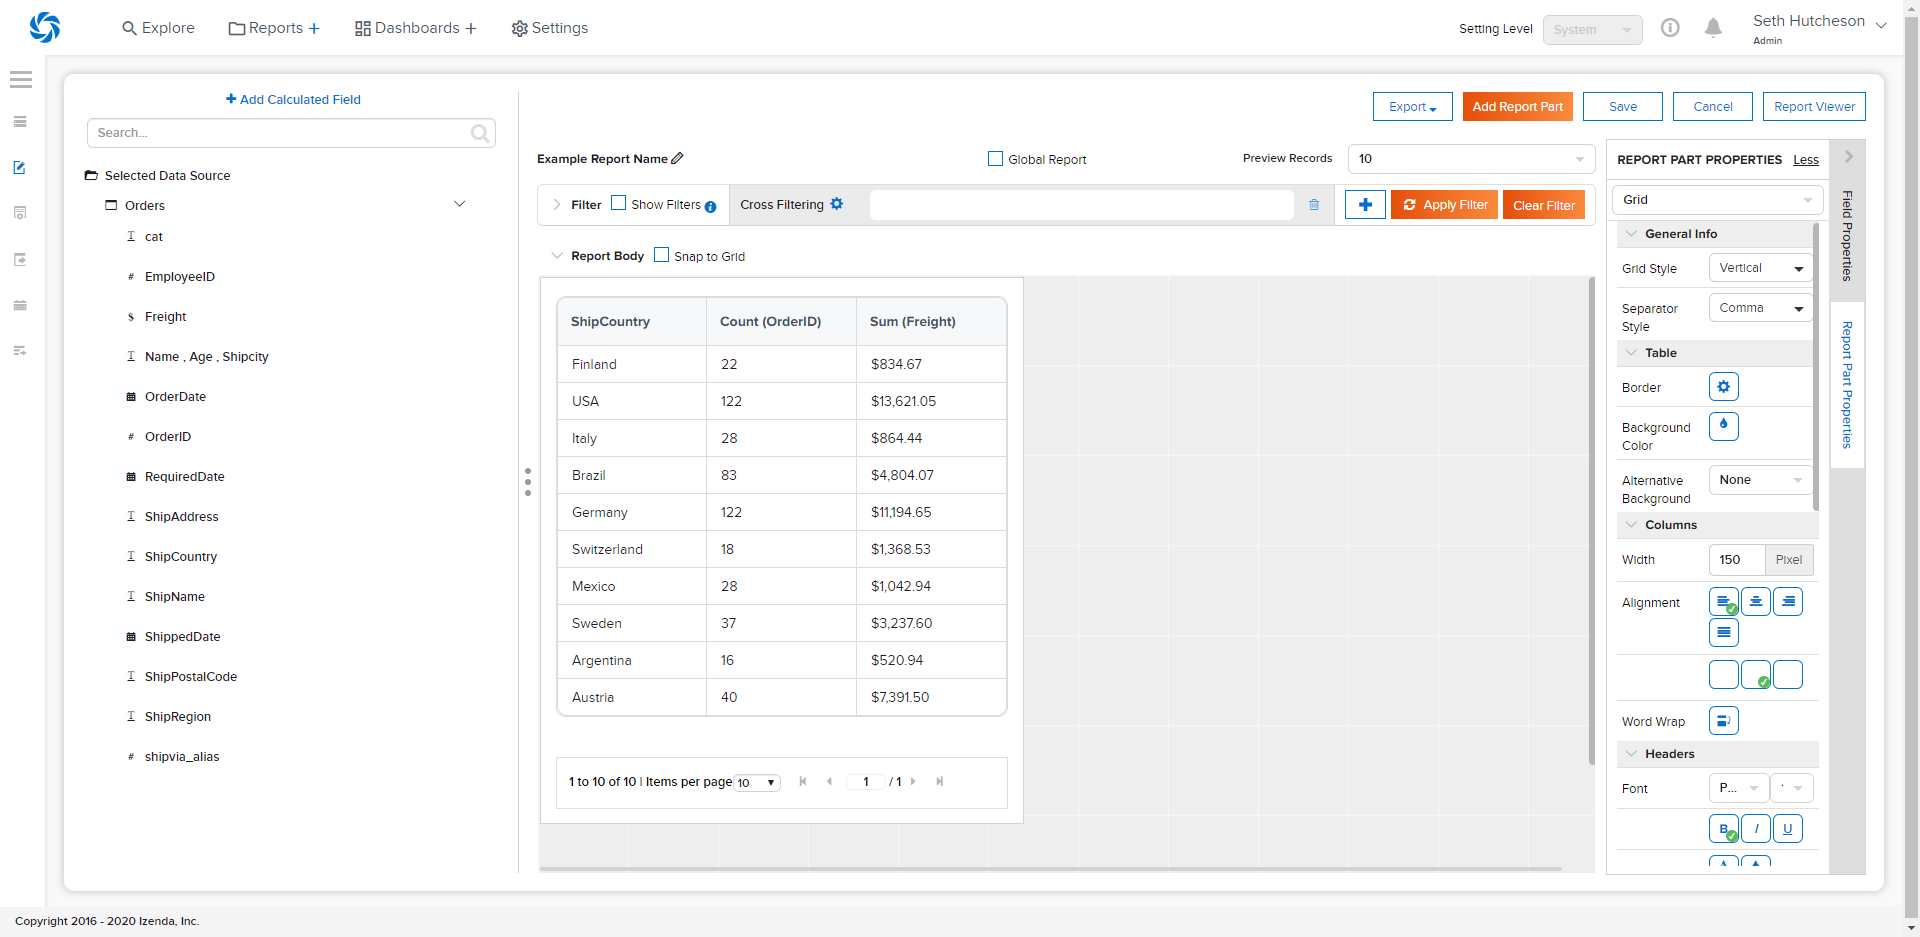
- New Report Designer (Beta)
- A new report designer can be enabled/disabled with the Report Designer 2.0 permission at the tenant or role level
- Functional Limitations of the new designer include:
- Report header/footer is not currently supported
- Opening legacy reports in the new designer is not currently supported
- It only supports the following visualizations:
- Vertical Grids, Horizontal Grids, Line Charts, and Column Charts
- For more overview information on the new designer, see our Beta Report Designer page
- Exporting Microservice (Beta)
- Exporting functionalities can now leverage the new web engine and a scalable node-based solution
- For more information, please see the Export Micro Service
- Scheduled Task Queue
- A new scalable solution is present to handle alerts and subscriptions that start at the same time so they may be performed sequentially and avoid overloading the server
- For information on this process, please see our Generic Queue mechanism for heavy load operations page
v3.11.4 Preview Release – December 24th, 2020
FEATURES
- Displaying Form CSS in Exports
- Two settings have been added to the IzendaSystemSetting table to determine this functionality:
- UseLegacyMhtExcelExport
- Setting this value to 1 will enable this functionality, exporting in the mhtml format for Excel
- Setting this value to 0 will disable this functionality, which is the default
- UseLegacyMhtWordExport
- Setting this value to 1 will enable this functionality, exporting in the mhtml format for Word
- Setting this value to 0 will disable this functionality, which is the default
- Display Field Names Under Pie Charts
- A new report part property, Show Values Field Names, has been added for Pie Charts
- When selected, the Values field in use for the pie chart will be displayed below the visualization.
- Remove extra Side/Sub Total columns in Pivot Grids
- A new checkbox is present for pivot grids next to the column containers
- This item is only present if ‘Add Side Total’ is checked
- When checked, all side total and subtotal columns will disappear
- The overall side total will be present, but each column-specific side total will be removed
- Asynchronous Exporting Improvements (Please see our Async_Configuration page for setup information)
- Node-based Deployment Support
- New values have been added to the application settings to help with deployment and scaling:
- izenda.jobs.routineprovisioned
- All background jobs, including async exporting, can be enabled on the deployed server.
- Useful for deployments in web farm environments
- izenda.jobs.asyncjobsenabled
- All async exporting jobs will scale using this setting
- New values have been added to the application settings to help with resource usage:
- AsyncJobMaxCpuUsage
- This setting checks total CPU usage in percentages and stops executing jobs when this threshold is met
- By default, this is set to 70
- AsyncJobMaxRamUsage
- This setting checks the total memory in use in percentages and stops executing when this threshold is met
- By default, this is set to 80
- Show grid headers at the top of report for exports
- A new report part properties, Disable Repeat Headers, has been added for grids
- When selected, the report headers will not be repeated throughout the grid and will only be shown at the top of the visualization
- Routine data deletion frequency can be configured
- A new value is set in the IzendaSystemSetting table, CleanDataJobInterval
- This value, set in days, will determine how old a deleted record has to be before it is permanently deleted from the configuration database
- By default, this is set to 7 days
- Dashboards will only display the current slide in Full-Screen Mode
- When the user switches to fullscreen, only the current slide view will be available
- The user can transition to other slides using the navigation buttons
- Remove Inactive/Deleted Users from Email events
- If a user is deactivated:
- The user will not receive any emails
- The user’s email will appear inactive on the schedule detail, list, and list view pages.
- If a user is re-activated all instances will resume as normal
- If a user is deleted:
- The user’s email will be removed from all subscriptions and schedules
- The user’s email address will not appear in the recipient lists
- Exporting no longer leverages Iframes for image generation
- SVGs are now used in place of the former Iframe approach
- This should resolve any x-frame-options security issues that may have been encountered
- Improved filter query performance
- Our query structure for filter values has been adjusted to be more performant
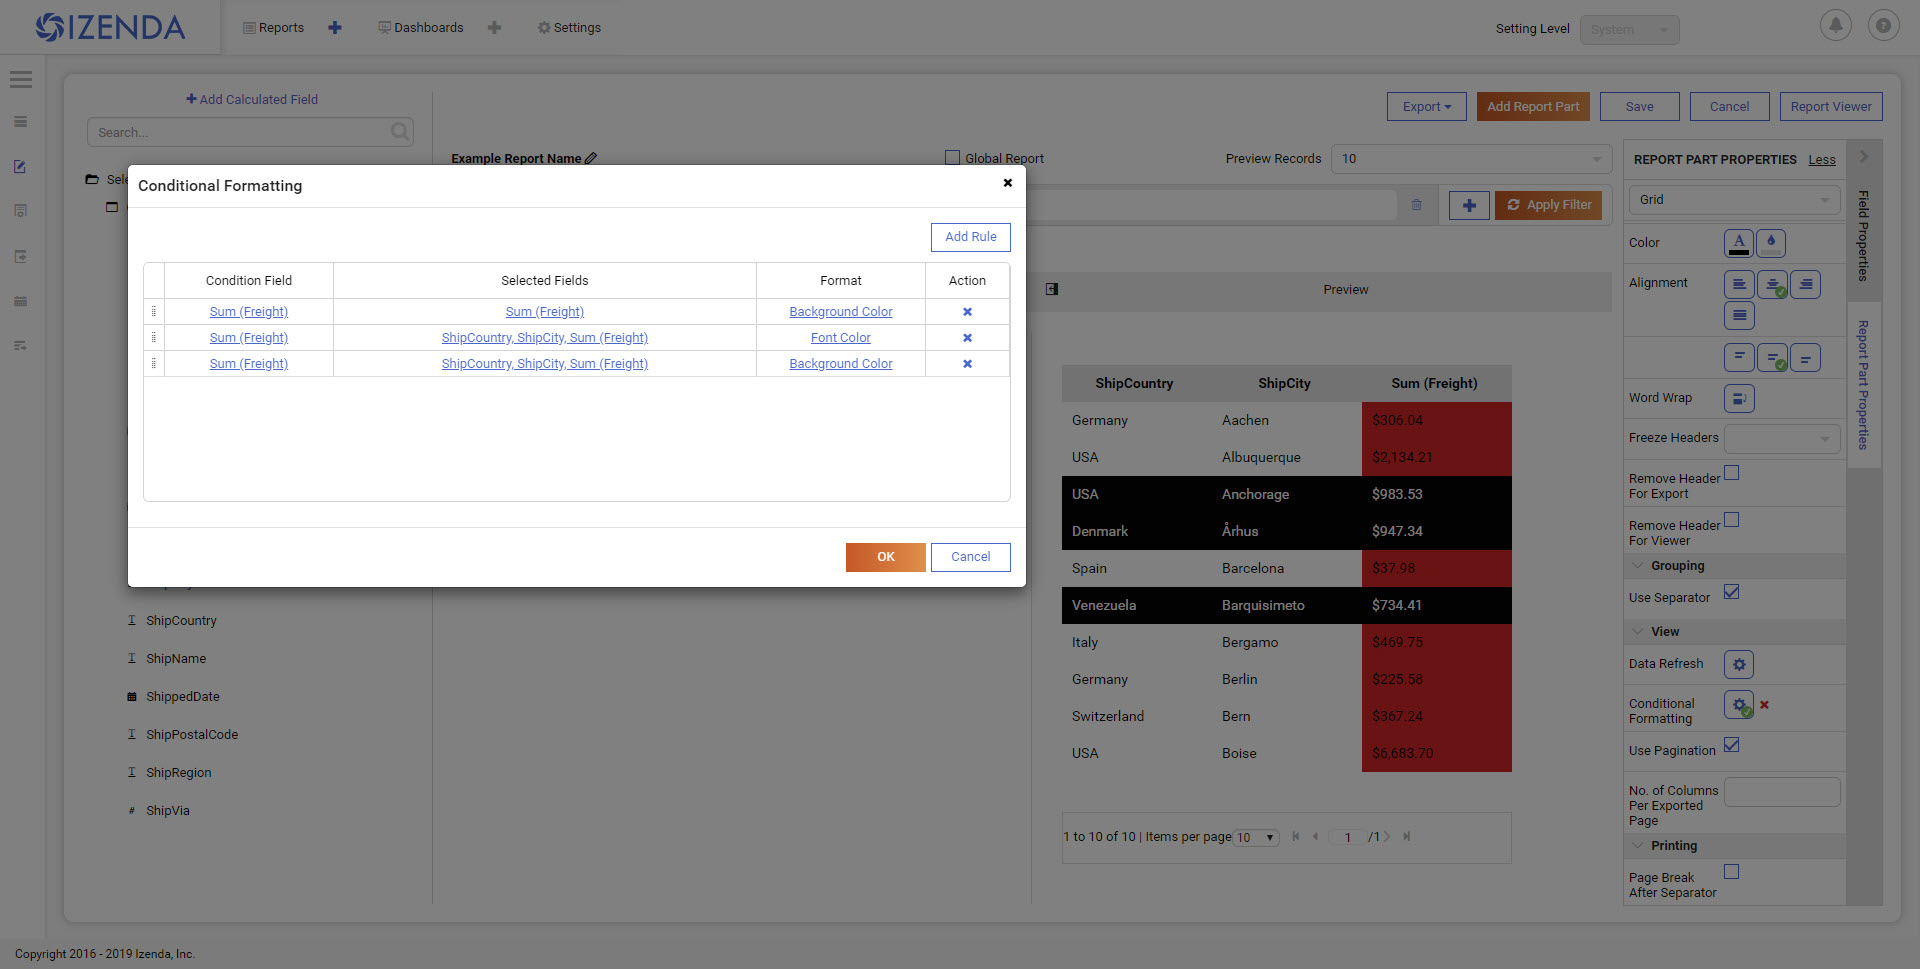
- Allow conditional formatting against null/blank values
- While this was previously possible at the field level, this functionality is now included in the conditional formatting for grids at the Report Part Property level.
- Improvements to Category and Report Sharing/Accessibility
- A new setting, ‘Prevent Report Sharing Based on Category Accessibility’ is added to the Role > Report permissions page
- When toggled OFF, if a report is shared with a role, the category accessibility is automatically updated based on the access rights of that report
- When toggled ON, if a report is shared with a role, the category accessibility for that role is not updated
v3.11.3 Preview Release – December 8th, 2020
FEATURES
- KPI Report Parts Added as Unique Visualization Type
- KPIs are now built as a separate report part type - This report part type can be selected during report creation in the same manner as existing report part types
- This report part type allows for users to input metric, text, and image tiles in a unique layout editor - Metric tiles currently only support one metric to be shown at a time. - Multiple text tiles can be created for each KPI which allow for light text entry and formatting - Multiple image tiles can be created for each KPI which allow for users to provide URLs for the images they wish to display in their visualization
- For more information please see the KPI Report Parts
v3.11.2 Preview Release – November 11th, 2020
Warning
Note that the Explore tab does not support changing tenancy, as mutli-tenancy is only at the configuration level
FEATURES
- PostgreSQL support for NLQ
- NLQ services can now be configured against PostgreSQL data sources
- NLQ Supports Multi-Tenancy
- NLQ services can be configured on a per-tenant basis
- This configuration can be manipulated by the administrator on a tenant’s behalf
- NLQ Grid Enhancements
- Column headers can now be used to apply formats and functions to each column
- This will allow users to sum, count, etc. directly on the grid
- For more information on NLQ please see our Natural Language Query
v3.11.0 Core Release – October 23rd, 2020
FEATURES
- PII Security Options
- A new dialogue can be found in the Data Setup > Advanced Settings > Security
- This dialogue will allow administrators to restrict how data is viewed internally and externally within the platform
- Administrators can determine which values should be replaced/obscured with symbols to trim out sensitive information
- These values can be configured to target specific tenants, roles, and users
- Information on configuring these rules can be found on the Advanced Settings page
v3.10.5 Preview Release – September 25th, 2020
FEATURES
- Tenant Grouping
- Tenants have a new value, Tenant Group, that can be applied on the Tenant Setup page
- Multiple tenants can belong to the same group, but a tenant can only have one tenant group value
- Tenant Groups can be used to distribute Global Reports in a more streamlined fashion
- When setting Report Access values, tenants can now be chosen directly
- Instead of choosing every tenant, users can select a Tenant Group, which will apply this access value to all tenants in that group
- Tenant Group and Tenant settings will take priority over Everyone-based rules
- Tenant Report Import Functionality
- Tenant users can now import report definitions into their instance of Izenda
- A new permission, Import, hosted under the Data Setup section of permissions enables this functionality
- This functionality can be restricted on a per-role basis
- Required Filter Expansion
- A new value in our config.json will allow Izenda to automatically expand filter sections if required filters are present
- This value is RequiredFilterSectionExpanded
- This value can be set to true or false
- This is meant to be used in conjunction with the ReportFilterSectionExpanded value
v3.10.4 Preview Release – September 8th, 2020
FEATURES
- Introduced new Asynchronous Export Functionality
- Async Exporting Interval
- This setting controls how often, in minutes, helper processes will evaluate the queue of export jobs
- Export Storage Option
- Admins can choose to leverage disk, AzureFileService, or AWSS3Bucket options
- AzureFileService options will leverage the connection string for the services
- S3 buckets will require the name, secret key, access key, and region values
- The disk will require a file path the API service can access and supports UNC paths
- Enable Smart Exporting
- Izenda will leverage a series of rules to determine if a particular report should use the legacy or asynchronous processes
- Will evaluate reports based off of average rendering time, composition or report parts, etc.
- By default, Izenda will leverage the asynchronous process if a report takes over 10 seconds to render or contains more than 3 report parts
- Enable Encryption
- This setting will determine if Izenda encrypts the files they generate
- Export File Refresh
- This setting will determine if Izenda will refresh the content of any exported files currently in the export Manager
- The job interval is a setting, in minutes, that Izenda will scan the exported documents and replace them with updated versions
- Deletion of Files
- By default, Izenda will archive any export files that are older than 7 days
- This value can be manipulated by changing the value of AsyncArchiveExportingInterval in the IzendaExportQueueSetting table
- New notifications
- The exported files will push notifications to the bell icon on the top-right of the Izenda UI
- These will allow the user to access their export manager and download any files they have previously exported.
- There is a value, IzendaSystemSettings table that determines how often we check for any notifications for a user
- By default, Izenda will check for new notifications to push every 60 seconds
- Export Manager
- The Export Manager will display a list of exported files the user has available to them.
- Users can easily download the same files from this page without having to run another export process
- A new front-end Javascript API has been created for integrations that can be found on our Front-end Integration APIs page
- An example can be found in our MVC5 Starterkit
v3.10.3 Preview Release – August 11th, 2020
FEATURES
- Set Alternative Text against NULL and BLANK values
- [NULL] and [BLANK] can be set as target values when creating rules
- Combination Charts can display multiple metrics on one shared axis
- Opening the ‘Settings’ wheel for any metric will let a user choose which y-axis to use for display purposes
- Users can choose from any other metric that is currently displayed on the chart
- UserContext can now be set without reloading Izenda components
- IzendaSynergy.setCurrentUserContext() now accepts a second argument, which will be passed as true/false
- This parameter, if set to true, will cause the items to be reloaded once the context is set
- This new value does not have to be set. If not explicitly stated, it is assumed to be false.
- Please see our Front-end Integration APIs page for examples
- Snowflake can now be selected as a reporting data source
- Example connection string: account=xxxx;user=xxxx;password=xxxx;db=xxxx;host=xxxx.east-us-2.azure.snowflakecomputing.com
v3.10.2 Preview Release – August 3rd, 2020
FEATURES
- Data Model Import/Export Phase 2
- UI elements have been added to compliment the APIs release in v3.9.5
- An ‘Export’ button is visible to System Admins on the Data Model Page
- Exporting will open a modal where users can select which data model objects should be exported
- The Import page can be used to import the new data model files
- Users can select which tenants should have their data models updated with the new object definitions
- These imports will require validations and configuration
- For more information, please see our Copy Management page
v3.10.1 Preview Release – July 27th, 2020
FEATURES
- CustomBootstrapper added for .NET Core Environments
- The CustomerBootstrapper functionality has been added for .NET Core resources
- This implementation can be found here: https://github.com/Izenda7Series/CoreIzendaCustomBootstrapper
- New IAdHocExtension Method Added for REST API requests
- A new method, OnPreRestApiRequest, has been added to the IAdHocExtension class
- This can be used to modify the request parameters for the REST request before it is sent
- Examples of this class can be found on our IAdHocExtension page
- New IAdHocExtension Method Added for Query Optimizations
- A new method, ModifyQuery, has been added to the IAdHocExtension class
- This can be used to modify SQL queries run by Izenda to improve performance or meet specific needs
- Examples of this class can be found on our IAdHocExtension page
- Configuration Database References Added to the API’s appSettings
- Users can configure these values to allow Izenda to read the configuration database’s connection without using the izendadb.config file
- For .NET instances, this value is set as izenda.config.connectionname with the database type being set as the value for izenda.config.providername
- For .NET Core instances, this value is set as izenda.config.connectionstring with the database type being set as the value for izenda.config.providername
v3.9.5 Preview Release – June 25th, 2020
FEATURES
- Data Model Import Export Phase 1
- The Copy Management APIs have been extended to allow the export of data model content.
- All content selected for the export will be present in a .bidm file
- The resulting .bidm file can be imported into any instance of Izenda that has this functionality to populate the data model
- When importing, a database mapping will need to be present, so connections will need to be established prior to importing.
- For more information, please see our Copy Management page
v3.9.4 Preview Release – June 2nd, 2020
FEATURES
- REST API Connectors have been Added
- Connections to REST API sources can now be added on the Data Connectors pages
- REST connections can include multiple endpoints to act as a collection of responses
- Each endpoint can be cached to avoid multiple requests on the endpoint as concurrency scales up
- Improved Data Connector Dialogue
- When adding a new connector, there is now a more dialogue-based approach to guide Users
- Iconography has been added to easily identify connectors
- The Connection Builder has been adjusted to allow connections to be edited more easily.
For more information, please see our Data Connectors/REST Connector page
v3.9.3 Preview Release – May 18th, 2020
FEATURES
- Tenant Templates functionality is released
- The base performance of Copy Management has been Improved
- Several new items have been added to the copy management workspace to extend which values can be copied from the source to destination
- For more information, please see our Copy Management page
v3.9.1 Preview Release – April 30th, 2020
FEATURES
- Natural Language Query Functionality Introduced
- User will be able to see a new default landing page labeled the ‘Explore’ tab
- This functionality can be enabled/disabled through tenant modules and permissions
- NLQ can only be currently leveraged against a single MSSQL data source.
- Information on configuring the NLQ functionality can be found on the Developer Guide pages.

- Grid Style Changes
- Izenda’s grids have been updated with a new modern styling
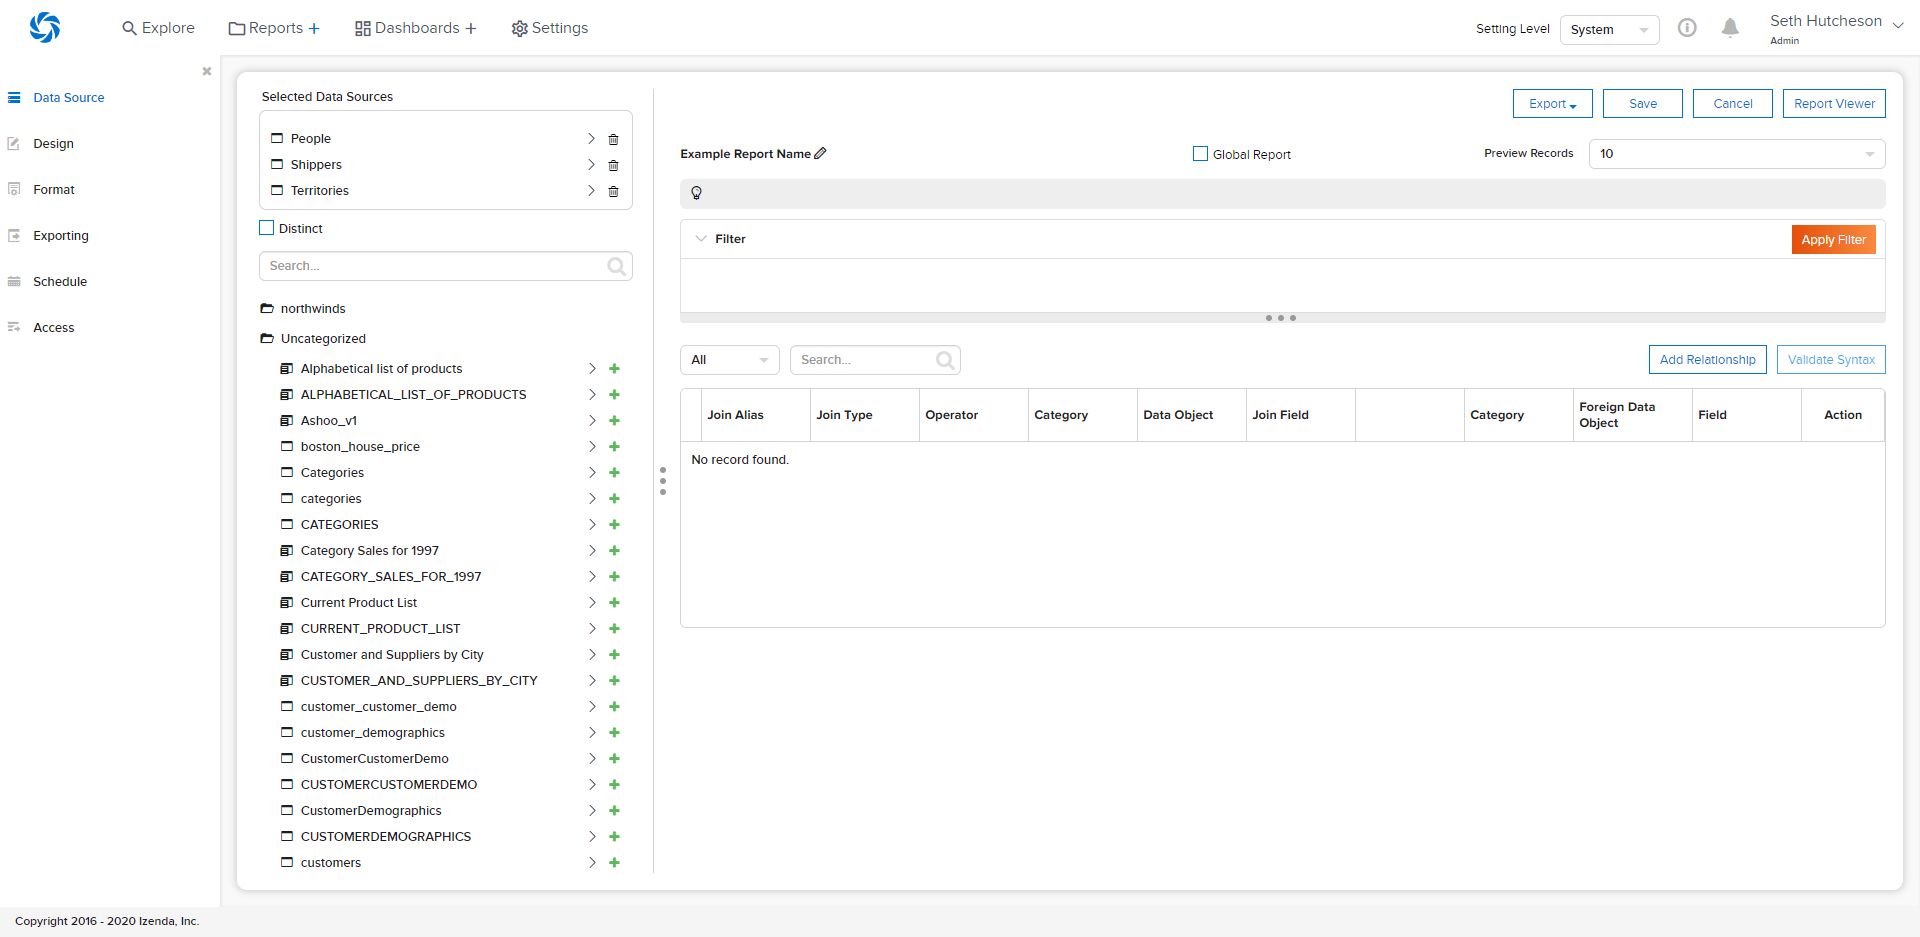
- Improved Datasource Selection
- When choosing data sources in the report designer, they are displayed in a list to quickly identify any selected items
v3.8.1 February 10th, 2020
FEATURES
- New IzendaSystemSetting Values for Chrome 80 Cookie Changes
- Two new values, CookieSameSite and CookieSecurity, were added to this table to impact cookies generated by the application
- CookieSameSite can be set to the following values: None, Lax, Strict
- CookieSecrity can be set to True/False
- The default value for CookieSameSite is Lax
- The default value for CookieSecurity is False
v3.8.0 January 15th, 2020
FEATURES
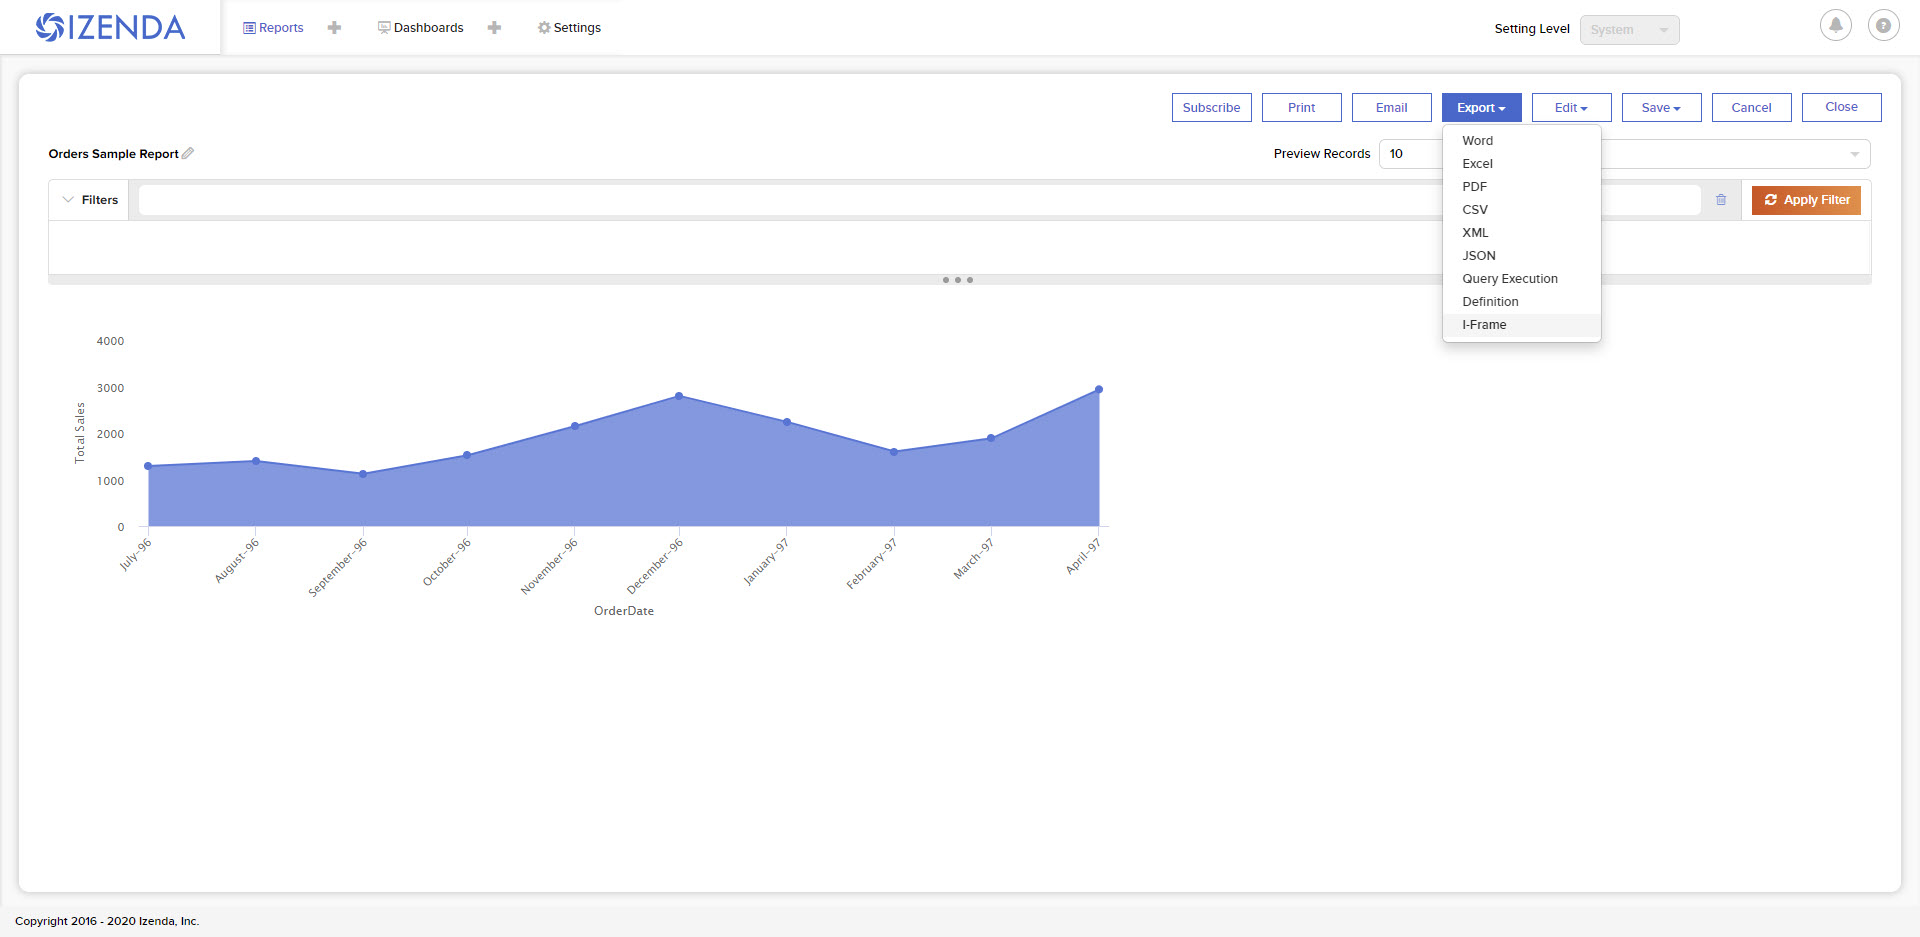
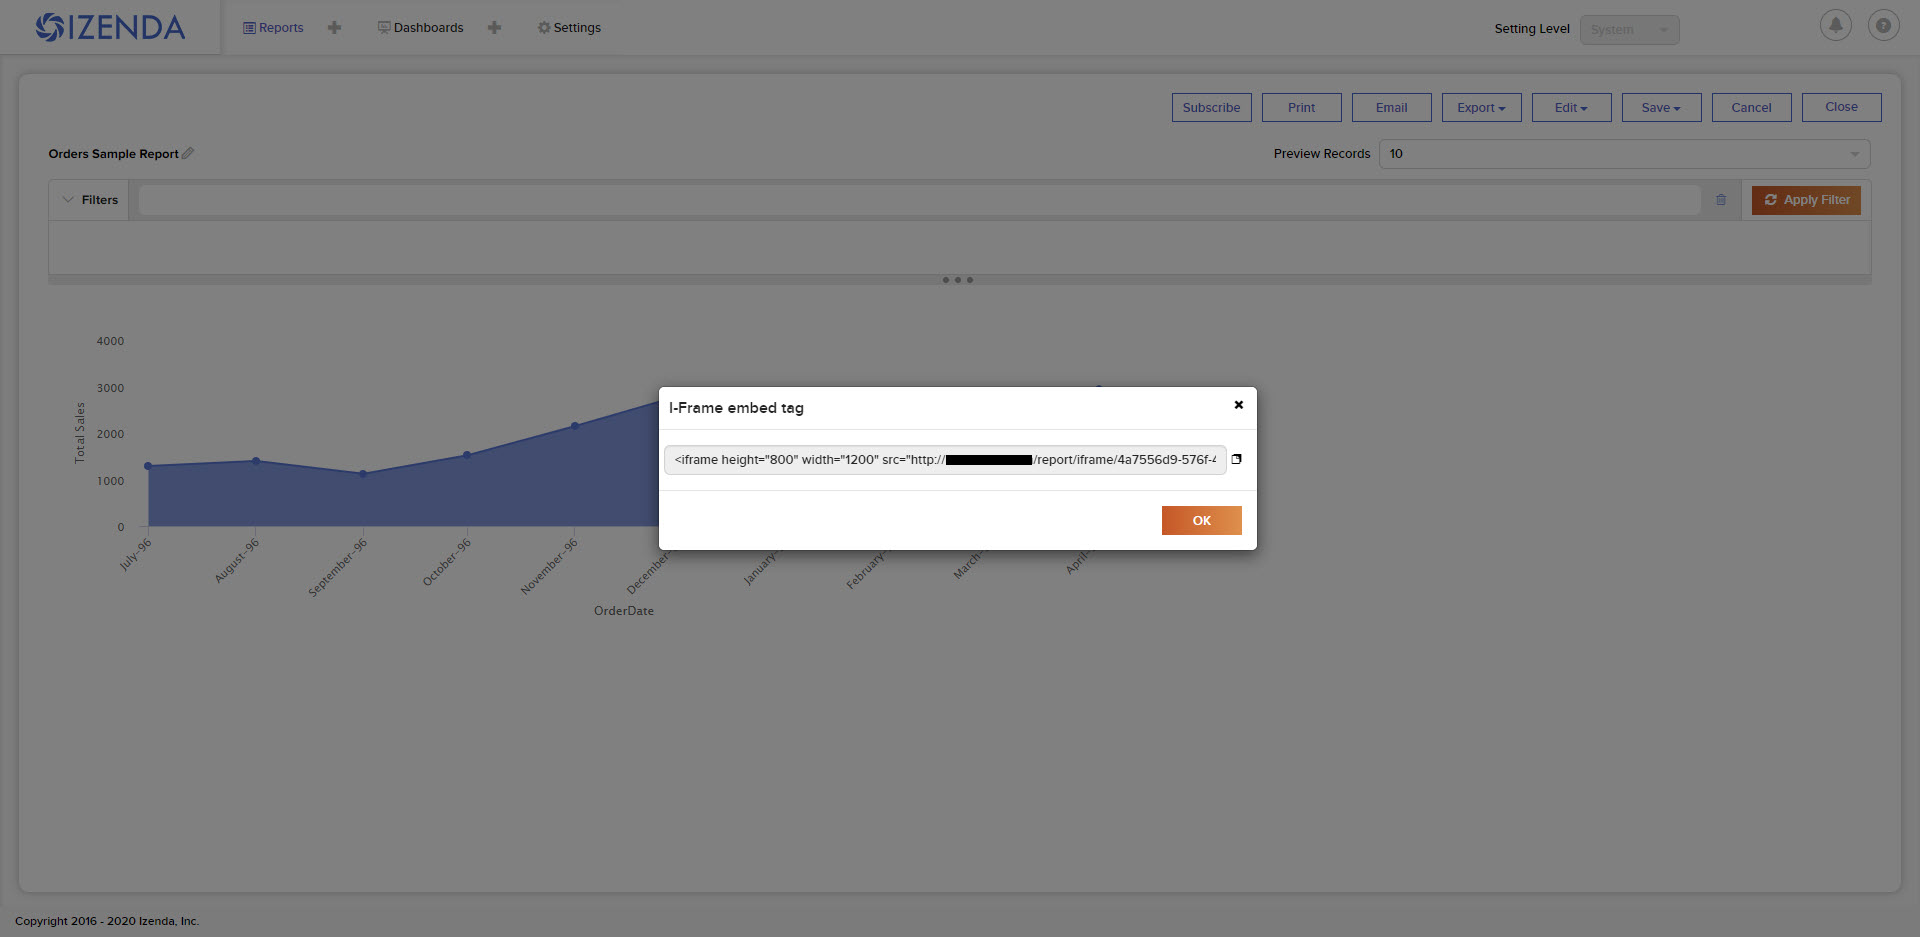
- Reports can be Exported as Iframes from the Report Viewer
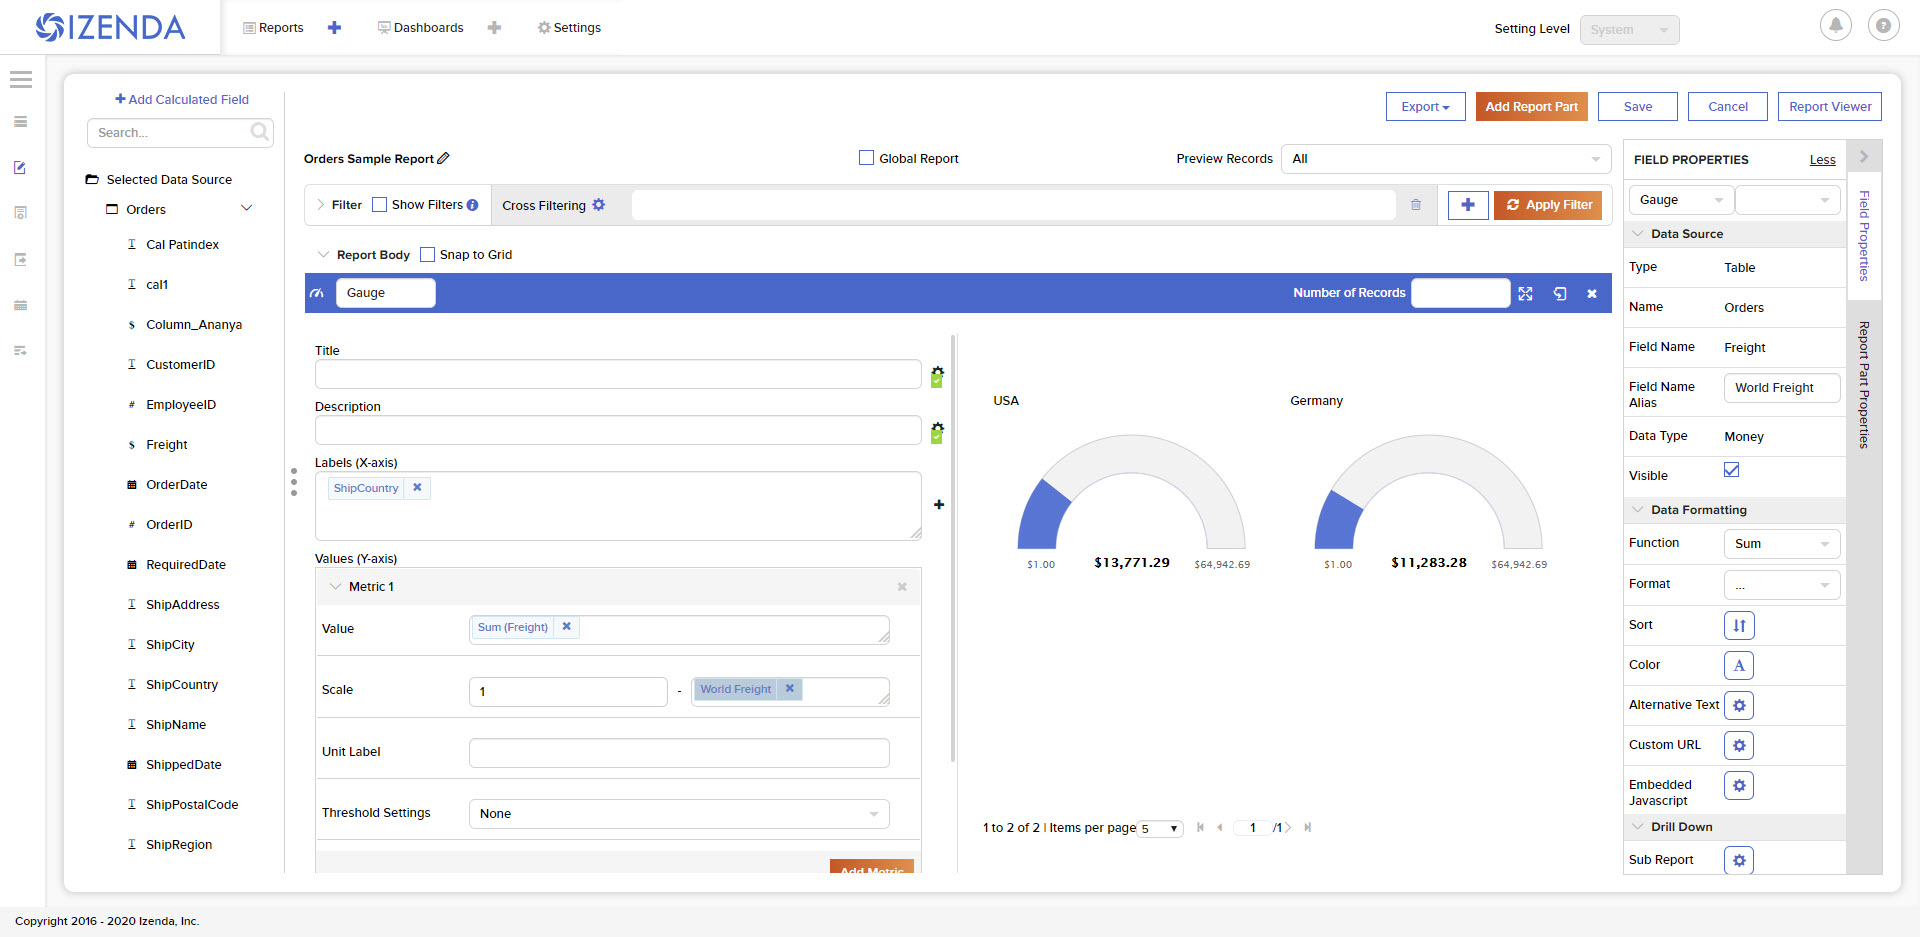
- Gauge Scale Inputs Accept Aggregated Fields
- The scale setting for gauges now accepts both text and fields.
- Feilds will be aggregated to create a consistent maximum or minimum scale value for all gauges
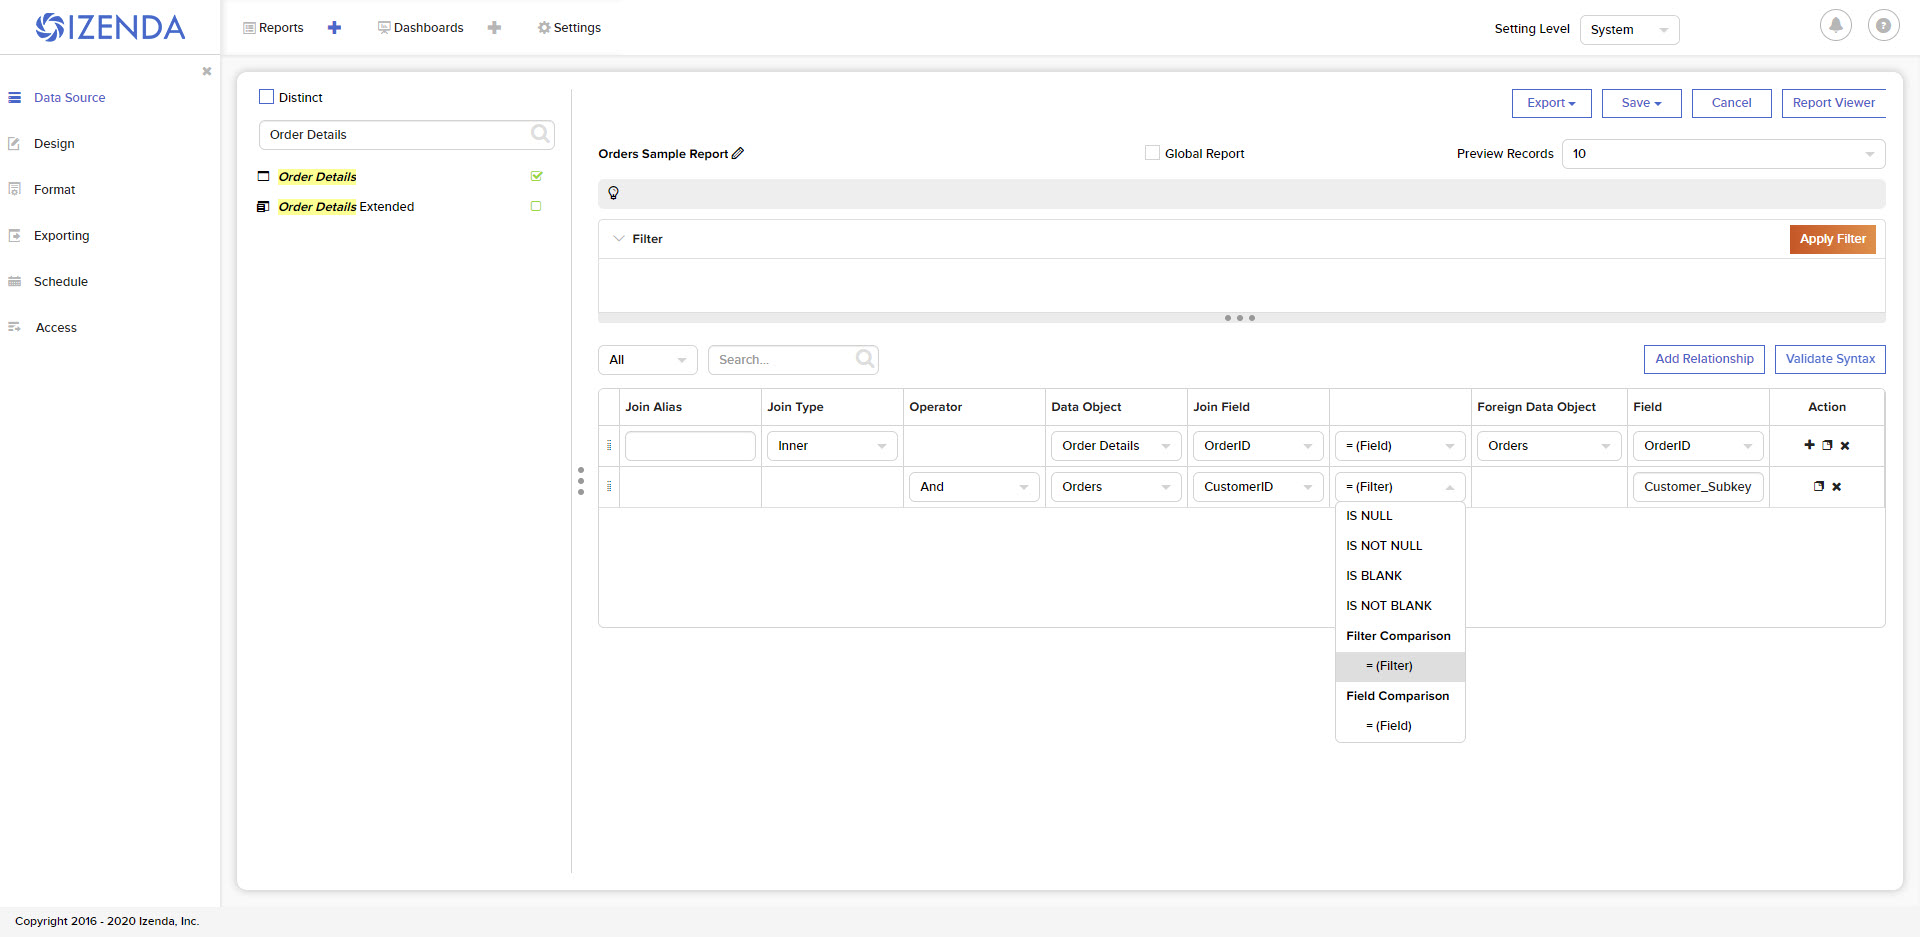
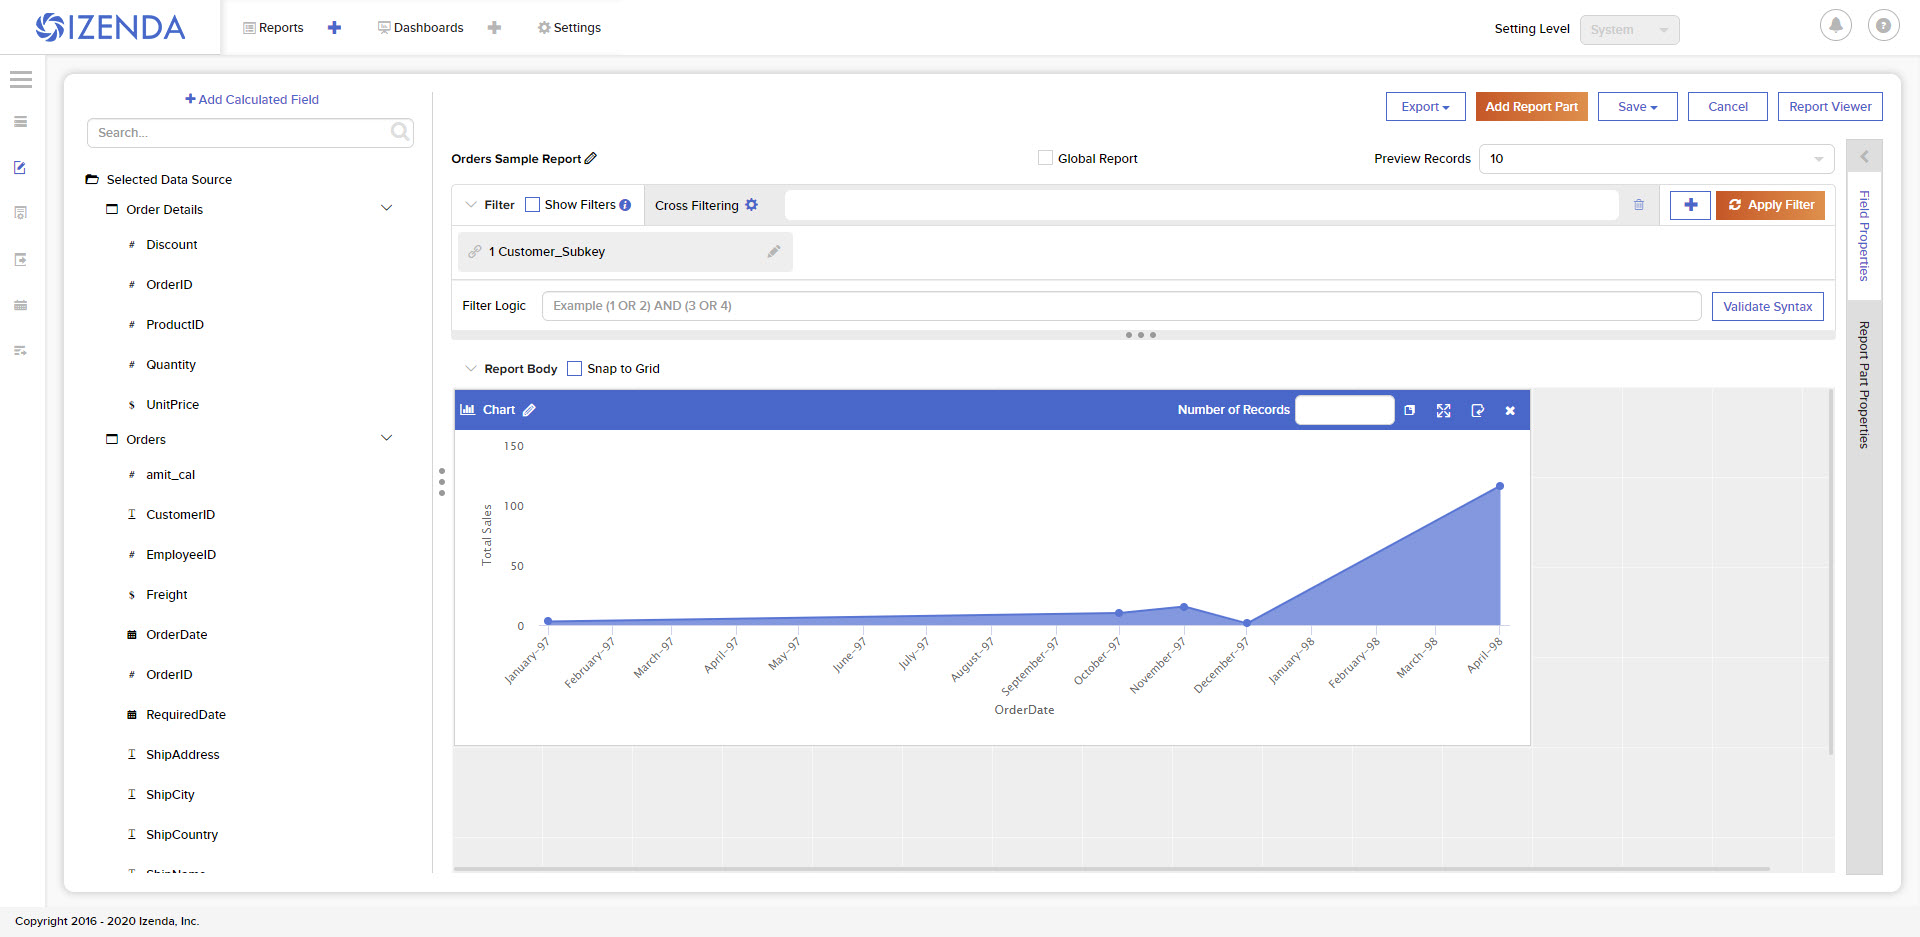
- Filters can Influence Subkey Conditions in Joins
- When defining subkey conditions for report joins, distinct filter objects can be created.
- These filter objects, when values are set, pass this value into the join condition of the report
- New Role API
- We have added POST api/external/role and PUT api/external/role/<Role GUID> to our API
- These APIs allow for a new Permission format to be supplied for creating/updating roles in the platform.
- This API allows for a new method of permission management where permissions are supplied as an array of values instead of a JSON object
- More information on these endpoints can be found on our External Role page.
Drillown Grid supports Grouping on Value Fields
v3.7.2 December 4th, 2019
FEATURES
- Conditional Formatting Dialogue Expanded to Pivot and Drilldown Grids
- The conditional formatting improvements from v3.7.0 can now be used within pivot and drilldown grids
- These are accessed under the Report Part Properties tab in the report designer
- HTML Rendering for Report Viewers and Exporting
- New settings are added to render HTML elements within data for Grid and Form report parts
- These are found under Settings > Data Setup > Advanced Settings > Security
- The Report Viewer and Exporting services can enable/disable this functionality independently
v3.7.1 November 26th, 2019
FEATURES
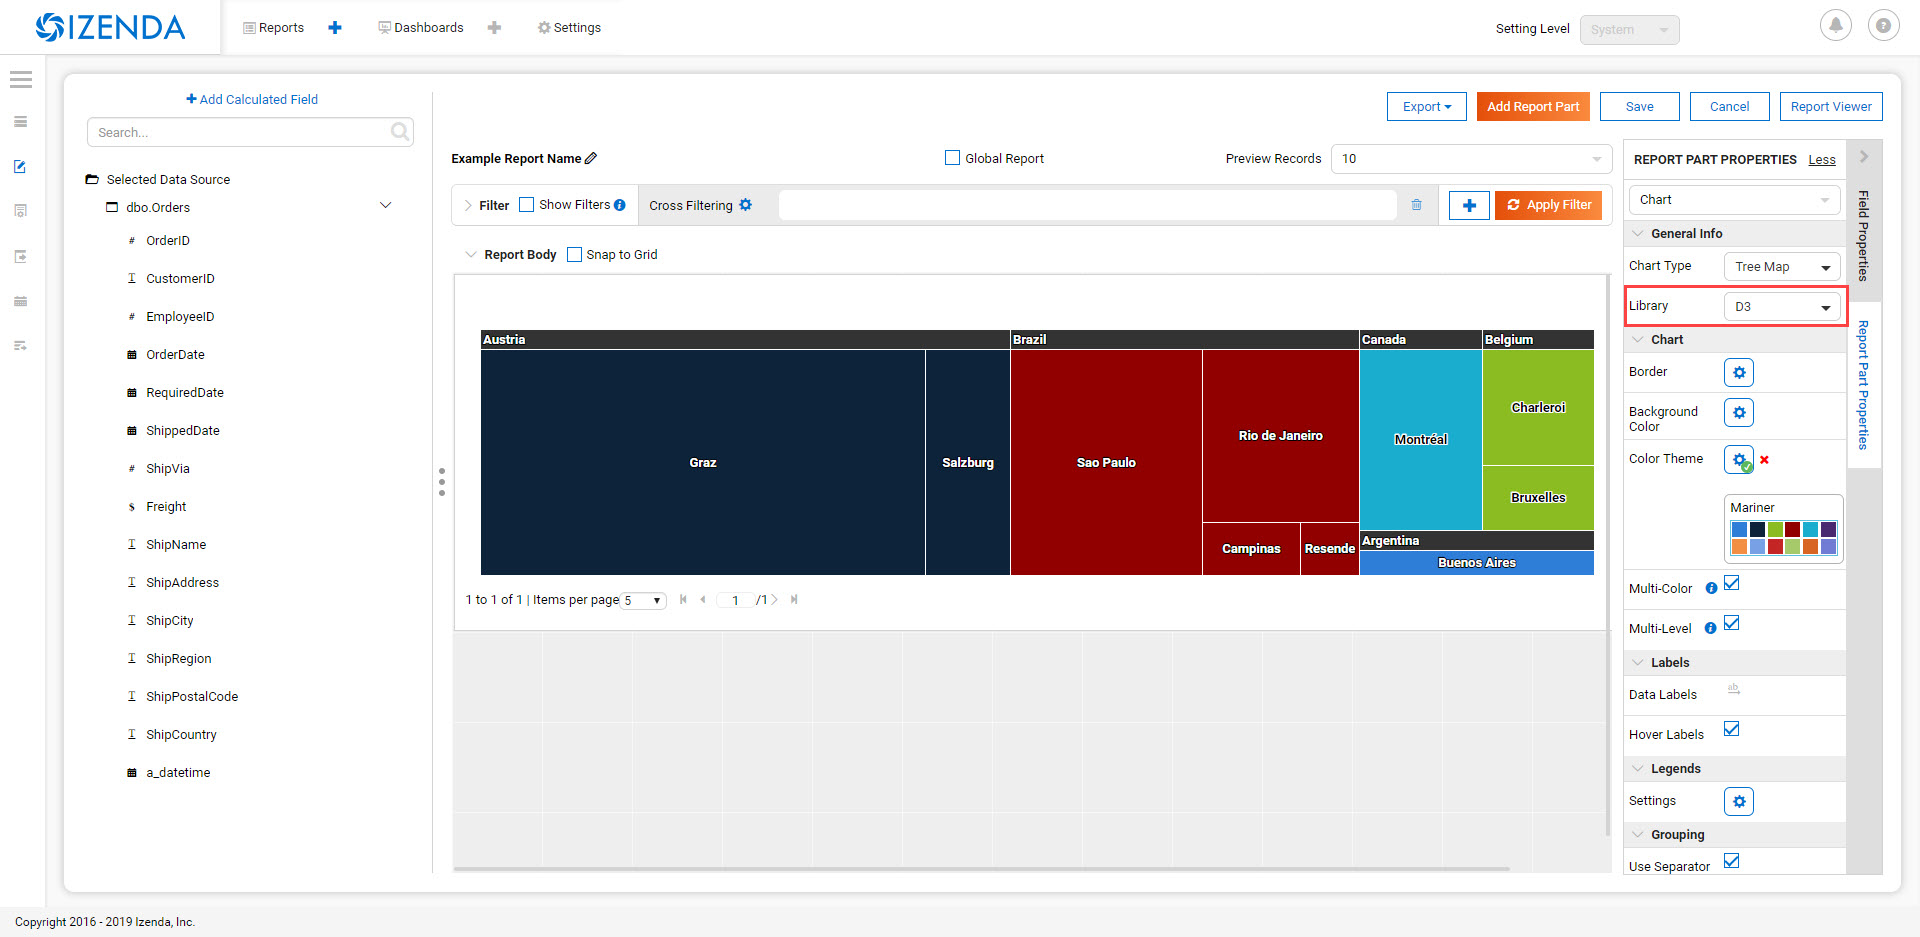
- D3 Library Implemented
- The first D3 chart in the platform is the Tree Map.
- This contains a unique Banner functionality when enabling Multi-Level when more than one X-axis field is present.
- You can select which library to use under the General Info section of the Report Part Properties.
- Configurable Front-end AJAX Settings
- A new parameter is added to our configJson element that allows for AJAX requests to be customized to suit a developer’s needs.
- This allows for developers to expand our request functionality to provide flexible integrations with Izenda.
- This new parameter expects a standard AJAX settings format.
  var DoIzendaConfig = function () {
      var hostApi = "http://localhost:31999/api/";
      var configJson = {
          "WebApiUrl": hostApi,
          "BaseUrl": "/izenda",
          "RootPath": "/Scripts/izenda",
          "CssFile": "izenda-ui.css",
          "Routes": {
              "Settings": "settings",
              "New": "new",
              "Dashboard": "dashboard",
              "Report": "report",
              "ReportViewer": "reportviewer",
              "ReportViewerPopup": "reportviewerpopup",
              "Viewer": "viewer"
          },
          "Timeout": 3600,
          "AjaxSettings": {
              xhrFields: {
                  withCredentials: true
              },
              headers: {
                  customheader: "customvalue"
              }
          }
      }
      IzendaSynergy.config(configJson);
  };
v3.7.0 November 13th, 2019
FEATURES
- Salesforce Connector Preview
- A connection string can be added to your Salesforce data for reporting.
- This requires three pieces of information: Email, Password, and Security Token
- Ex. User=myUserName@test.com;Password=pa$sw0rd;Security Token=Al9q7nmDJW3ib0NBiLEnYz;Verbosity=3;
- Continued Grid Enhancements
- Blank rows can be added to pivot grid expanders for better visual spacing.
- A new conditional formatting option exists for Horizontal and Vertical Grids
- This allows for conditional formatting to impact entire columns or entire rows
- This will be expanded to impact pivot and drilldown grids at a later date, as well as having a more comprehensive UI.
- Conditional formatting options were added to support bold, italics, and underline formatting for grids.
- Pivot grids can have all expander items collapsed/expanded by default
- Calculated Fields support New Line character
- Expanded API response behavior for error handling
- Added a new elemenent to the configJson element, ErrorHandler.
- You can specify a function that is assigned to this element that will can handle certain error responses from the API.
- This allows you to provide more detailed feedback or handle failed request made against the API.

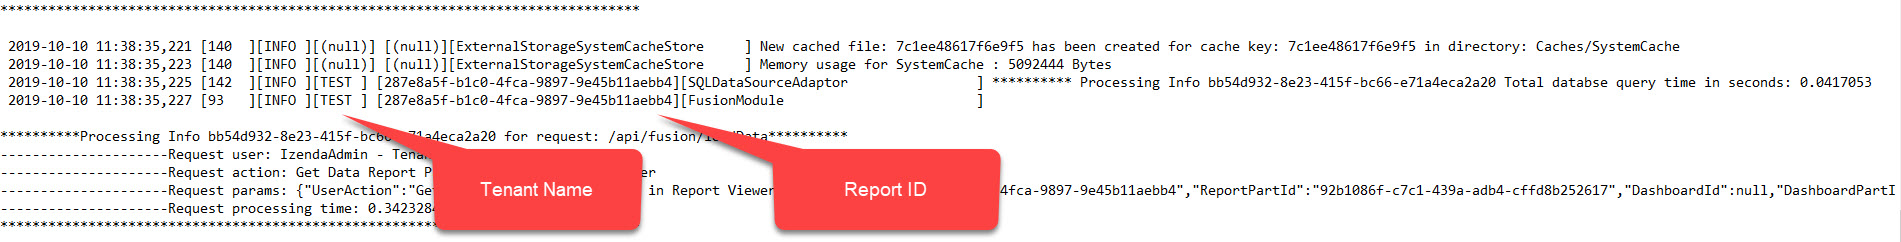
v3.6.0 October 10, 2019
FEATURES
- New User Load API
- We are introducing a new external user endpoint: GET api/external/user/loadUser
- This endpoint is meant to return user information for a single user at a time, as opposed to a bulk load.
- For our documentation on this endpoint please see our External User API page.
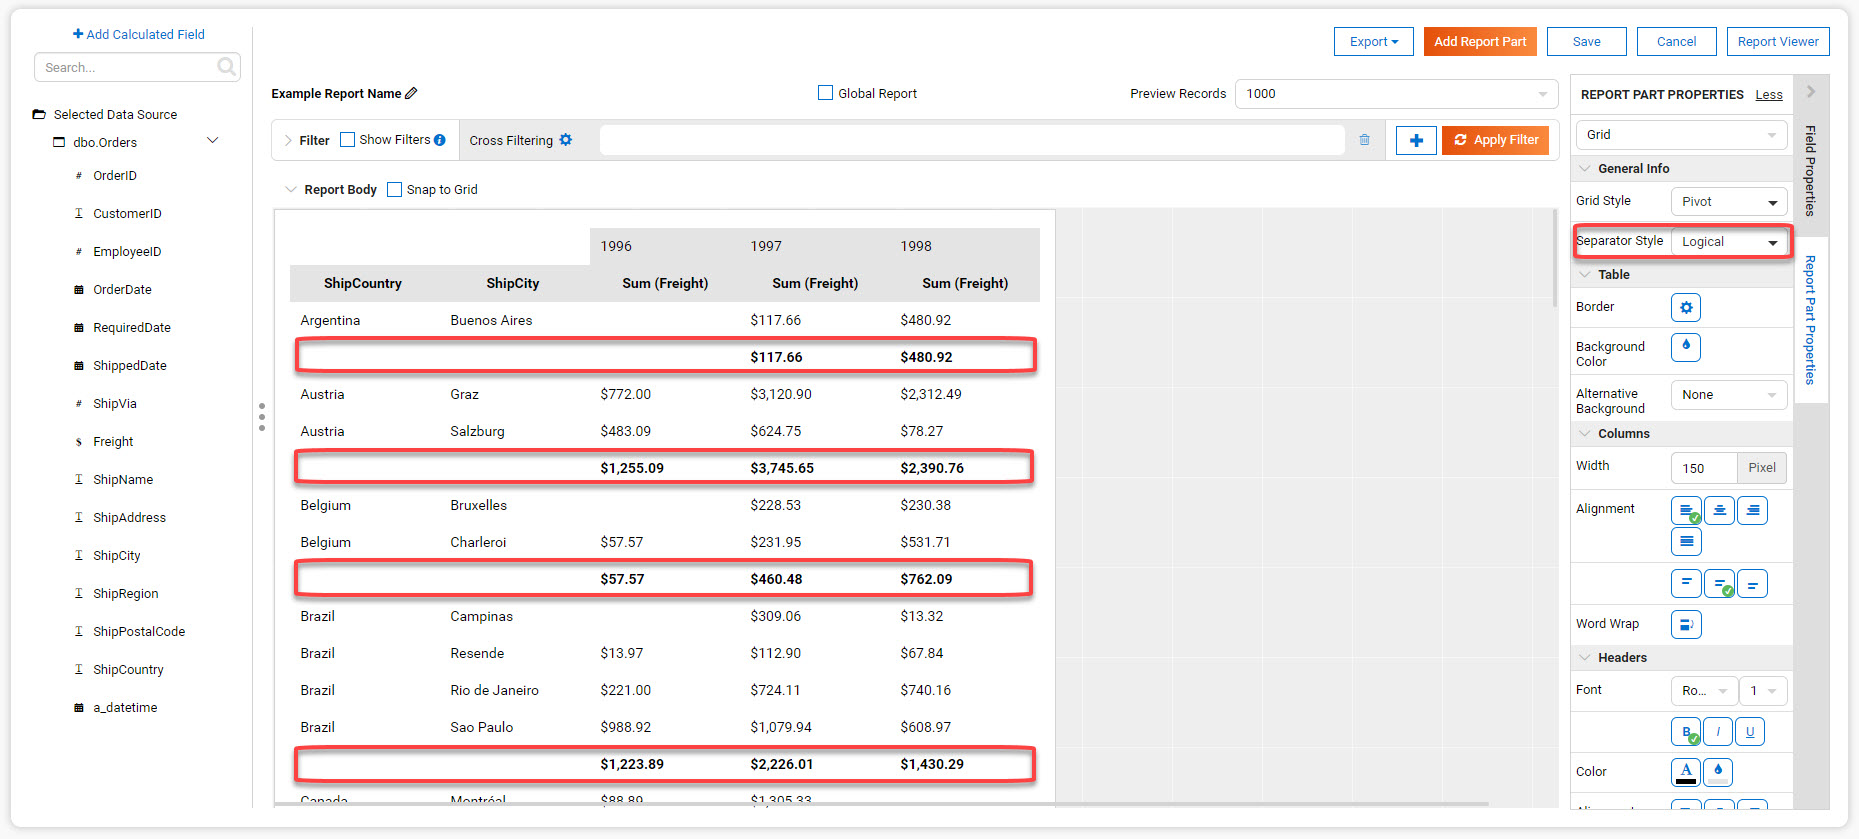
- New Separator Option for Pivot Grids
- We have introduced a new separator type, Logical, for pivot grids.
- This separator will block out data within the pivot without creating a new grid instance, keeping all of the data in-line.
- If subtotals are enabled, these will be rendered in-line with the grid, creating total rows below each logical separator grouping.
- Visibility Toggle for User ID and User Profile
- Two new options exist under System Configuration > Security Policies
- These items will let a user specify if the UserID value should be shown in the profile, or if the profile page as a whole is accessible.
v3.5.0 September 10, 2019
FEATURES
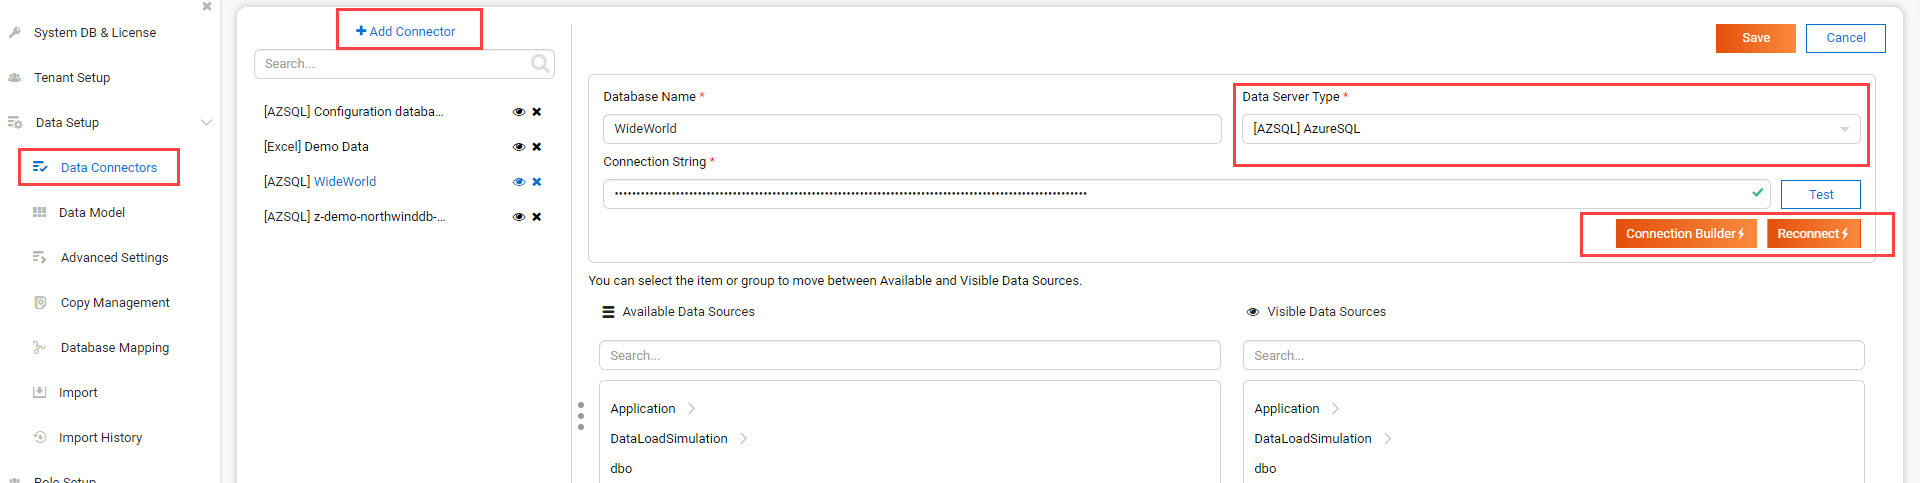
- (Beta) Excel data sources can now be added as reporting data sources.
- The Connection Strings page is renamed ‘Data Connectors’
- The ‘Add Connection’ option is renamed ‘Add Connector’
- The layout for this page is slightly adjusted to make better use of the space.
- The sheets, once added, cannot be updated by re-uploading a sheet to the same connection.
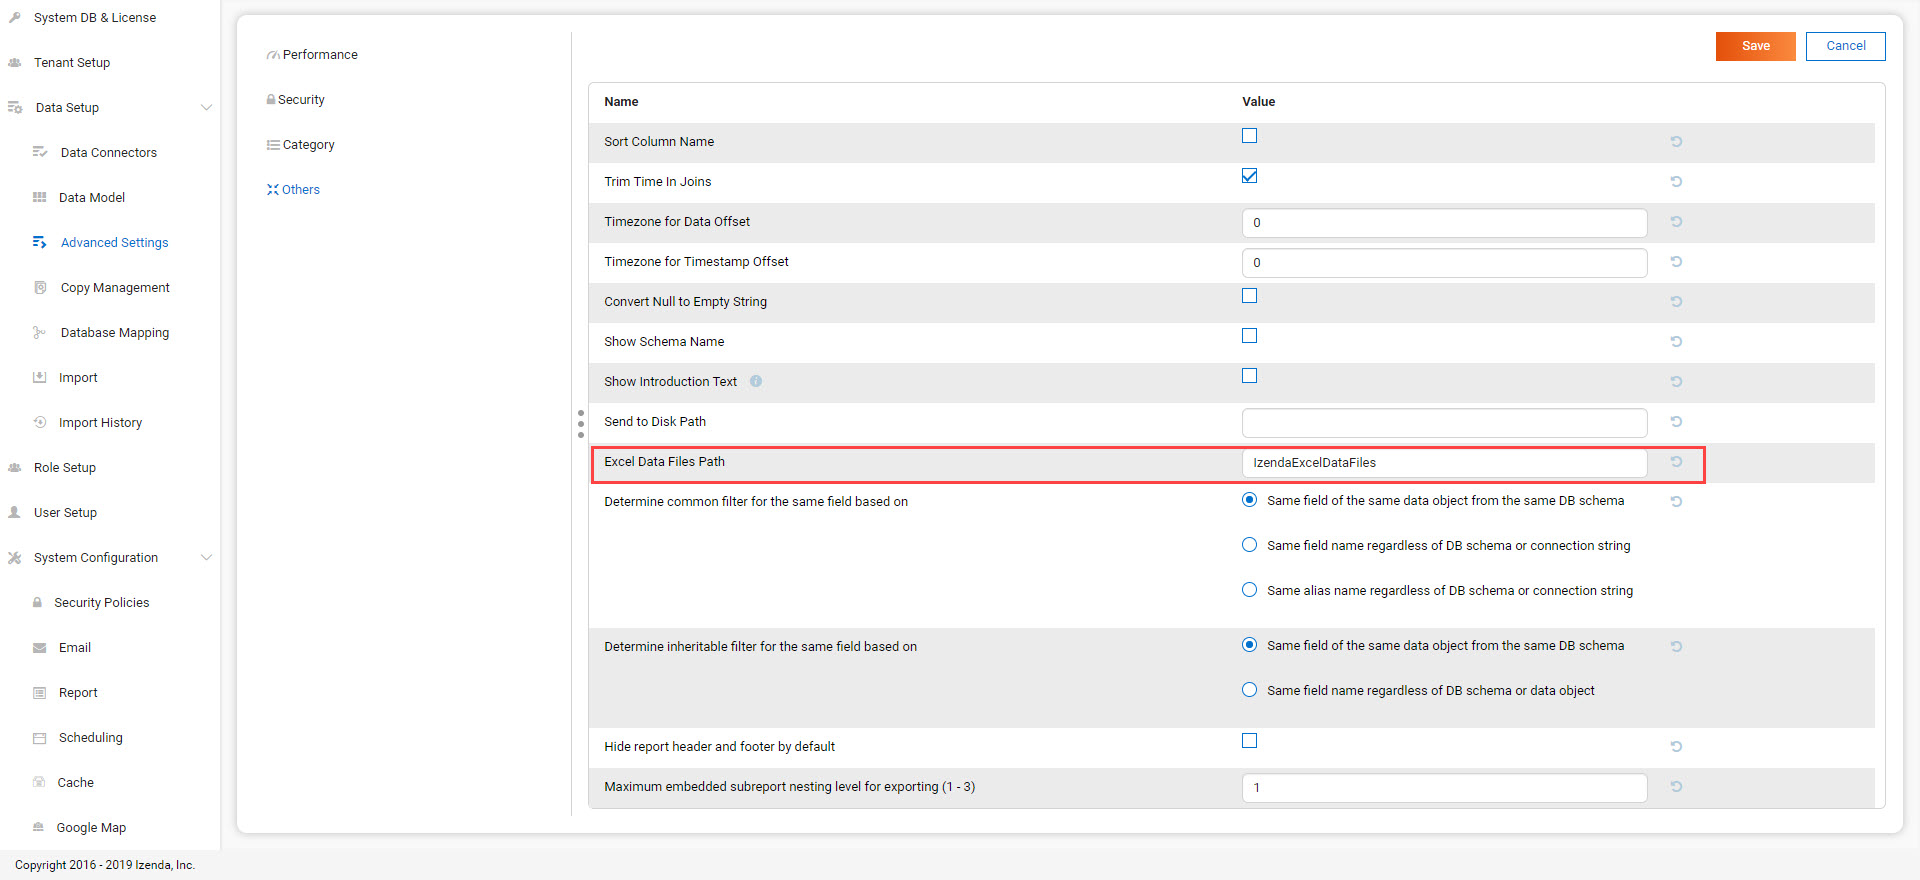
- Under the Advanced Settings > Others you can name the folder where Izenda will store these uploaded files
- This supports local directories or UNC paths
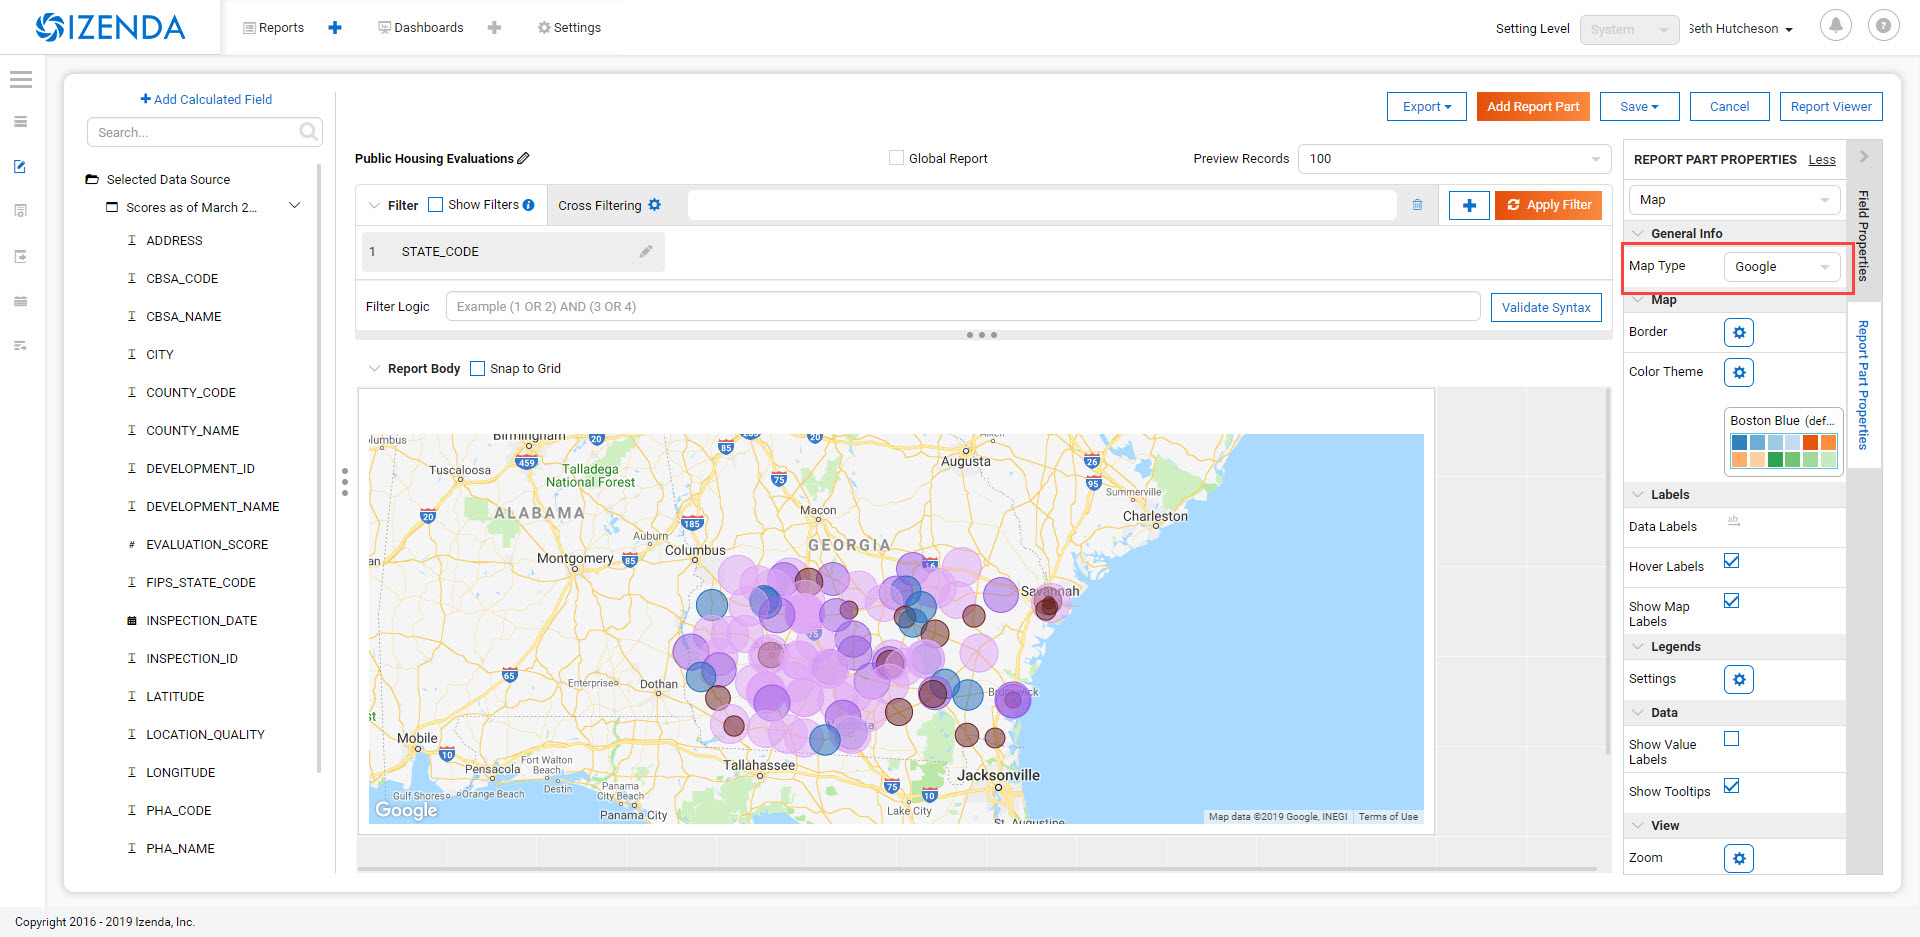
- Google Maps can now be selected when creating a map report part.
- Google can now be chosen from the Map Type dropdown
- This requires that a valid Google API key is set in the System Configuration > Google Maps page
- There is an additional option ‘Google Address’ that lets users leverage address information and Google will obtain the Lat/Lon coordinates
- Note that this behavior requires a premium API key and must be enabled.
- This will have a corresponding permission that enables whether or not users can leverage this feature.

- Ability to hide grid headers from the report viewer.
- There is an added Report Part Property that, when selected, will remove the headers row or column from the grid.
v3.4.1 August 23, 2019
FEATURES
- Introduced CORS Policy Configuration for the .NET Core API resources for Izenda
- Added the izenda.cors.removepolicy setting
- This can be set to true or false and is set to false by default.
- True: Izenda does not set any CORS policies on the sites
- False: Izenda will use the subsequent three CORS settings for the sites
- Added the izenda.cors.alloworigins setting
- Supports the same values as our .NET Framework Web.config settings
- Defaults to the ‘*’ wildcard character to allow any origin
- Lists of values should be comma-separated with no space: ex. “http://www.yoursite.com/example”
- Added the izenda.cors.allowheaders setting
- Supports the same values as our .NET Framework Web.config settings
- Defaults to the ‘*’ wildcard character to allow any header
- Lists of values should be comma-separated with no space: ex. “Accept,Origin,Content-Type”
- Added the izenda.cors.allowmethods setting
- Supports the same values as our .NET Framework Web.config settings
- Defaults to the ‘*’ wildcard character to allow any method
- Lists of values should be comma-separated with no space: ex. “GET,PUT,POST,DELETE,OPTIONS”
v3.4.0 August 16, 2019
FEATURES
- Machine Learning Infrastructure Addition
- The Prediction, Classification, and Forecasting model infrastructures are included.
- System Cache Beta Implementation
- A detailed description of caching setup and configuration can be found on our System Configuration/Cache page.
- The system cache is enabled by default.
- There is no ability to disable the system cache with this release.
- Drilldown Grids can be Exported at the Current Expansion Level
- When using drilldown grids, you will receive a new pop-up when choosing to export your report if you have modified the grid.
- This pop-up will let you designate if we’re exporting all records in your drilldown grid, or the records as you’ve configured them (expanded vs collapsed)
- Users will be able to leverage this functionality to create more fidelity between drilldown grids in the platform and in their exports.
- Join Logic can be Toggled Between Behavior before 2.18.1 and after 2.18.1
- Defect 22764 was resolved in v2.18.1 of Izenda which required adjustments to our query engine.
- Reports that leverage order-specific join structures or LEFT/RIGHT joins may have seen their data change.
- To toggle this you will need to edit a value in the web.config (.NET) or appsettings.json (.NET Core)
- This is the following value: <add key=”izendaJoinStructure” value=”true” />
- This is a boolean value, which should be set to true/false and is true by default.
- To leverage the older join logic you should set this value to false.
- Note that this is an APPLICATION-WIDE setting, meaning that it is not configured per-tenant.
DEFECTS
- For Defect 22502, there is an additional behavior where conditional formatting isn’t applied when Custom Formats and Repeaters are in use (Defect 24687)
- For Defect 23976, there is an additional behavior where no alert is provided when a user naviagtes to the Report Viewer from the Report Designer after editing the report if they have not saved.
v3.3.1 July 23, 2019
FEATURES
- InTimePeriod filters reflect more accurate timezones
- When opened in the application, these filters will be offset by a user’s Data Offset value instead of using the API server’s UTC time.
- When sending an embedded or attached report, senders will be able to leverage the Time Zone setting for the schedule/subscription for InTimePeriod filters.
- Multiple Selection filters now support delimited lists.
- You can provide Comma and New Line delimited lists as valid inputs
- Select ‘None’ in the delimiter selection dialogue if you want to leverage historical behavior.
- Izenda can load on pages with pre-existing Highcarts references.
- Izenda will make a backup of the customer Highcharts reference, reset the Highcharts global variable, and then load our resources.
- After Izenda’s Highchart resources are loaded, we will restore the customer resources.
v3.3.0 July 15, 2019
Note
- The System Cache portion of this behavior will be released in a future version of Izenda.
The System Configuration > Cache page allows an administrator to manage users.
FEATURES
- Data Caching Beta is now Implemented
- A detailed description of caching setup and configuration can be found on our System Configuration/Cache page.
- We will be adding system-level caching (roles, validation, etc.) in a later release.
- No caching will be enabled by default, so you must set this up via the configuration page in the application.
v3.2.0 June 4, 2019
FEATURES
- Report Headers Scale to Reduce Whitespace
- Any unused rows in the report header will be removed, decreasing the overall whitespace seen in the report viewer and exports.
- Adding new objects into the report header will allow you to add new rows of content, up to the original height, if required.
- New Filter Properties Interactions
- The Filter Properties Panel now resides within a pop-up dialogue.
- Clicking on a filter object will open a pop-up that lets you select the operator and the value(s).
- Right-clicking on a filter object and selecting ‘Edit’, or clicking on the gear icon will open the Filter Properties pop-up that used to be among the right-hand panels.
- New Filter Interactions
- The ‘Between’ operators are reworked to consume less space.
- The ‘Between Date’ operator is more streamlined and will allow both dates to be selected from a singular dialogue.
- GetAccessToken is expanded for Grid and Form Exports
- For integrated scenarios, grid and form exports will now set the user context in the same manner as chart exports, allowing for the same approach to security and token management.
- Subreports Allow Users to Pass Field Values into Input Parameters of a Report
- When setting up field mappings for subreports, you can now pass field values into the input parameters of stored procedures.
v3.1.1 May 16, 2019
Warning
- (5/16) If you are using the ADOJobStore, you will need to explicity state if you are using binary or json serialization.
- (5/16) For an existing ADOJobStore setup please use the binary serializer type, but please note that this is not supported when targeting .NET Core.
- (5/16) For new configurations and .NET Core instances, the serializer type should be set to json.
- (5/16) For Quartz, ADO.NET provider names have been simplified and are without version. e.g. SqlServer-20 => SqlServer
- (5/16) For these Quartz migration changes please see their migration guide here.
v3.1.0 May 9, 2019
Warning
- (5/9) In version v3.0.0 the IAdHocExtension implementation would only be picked up if the assembly name began with Izenda. This was resolved in the v3.1.0 release.
- (5/9) In addition, due to changes in our internal reference, please make the following changes to your references/implementation found here.
- (5/14) A user in a load-balanced environment has reported inconsistencies with scheduling. We are investigating and will provide a fix, if necessary, as soon as possible.
FEATURES
- MongoDB Available as a Reporting Datasource
- We’ve introduced MongoDB as a new datasource for reporting. This means that you are able to select Mongo from the Data Server Type dropdown when adding a new connection string.
- We support Mongo v2.6 or greater in this release.
- Key Joins Support Multiple Values
- When creating key joins in the Data Sources page of the report designer, previously you were limited to only a singular value. This meant that for every unique value you wanted to join against, you would have to create an additional key join. Now you can hit enter once you’ve chosen or entered your value, and then continue to add them for the = and <> operators.
- Pie Charts Support Drilldown Actions on the ‘Others’ slice
- While designing a Pie Chart, you normally have the ability to set a value for ‘Bottom X% Grouped to Other’. When enabled, a slice on your pie chart will be labeled ‘Others’ and it is the combined value of items that fall within your setting. Previously, if a drill down was set up on your chart, you could not see any underlying data for that slice. Now, if drilldowns are set for your pie chart, you will see a pop-up when clicking on the Others slice. This will let you choose any value within the Others slice to drill down on so you can see the lower level of data for that particular value.
- New Datetime Picker
- Our goal for the immediate future was to help modernize and streamline our filter interactions. In order to do this, we needed to switch out our underlying library for DateTime interaction and replace it. Now that we’ve done this, the calendar picker for all DateTime values throughout the application will change accordingly. Please note that while this change is in place now, some optimizations for filter space and presentation for these will be released in v3.2.0 now that the underlying libraries are in place.
- Update Results Button Relocated
- To help streamline filter and report interactions, we’ve relocated the Update Results button to be within the filter container. This way, as your users are setting their filter values, the ability to immediate update the report to reflect that new data is located in the same vicinity so their attention stays with their workflow.
- Filter Panel - Space Consolidation
- As a step towards responsive filter design, we’ve begun to consolidate the use of space within the filter panel. We’ve abbreviated ‘Show Filters Under Report Description’ to save space and added a tooltip. Additionally we’ve changed the ‘Add Filter’ button to a ‘+’ icon to make room for the Update Results button.
- Close Button in Viewer Methods
- Previously, when use either the renderReportViewerPage or renderDashboardViewerPage endpoint, the ‘Close’ button will still be present. When selected, it would bring the user back to the report or dashboard list. In order to respect the workflow of those pages, the Close button will not be rendered when using either of those rener methods.
- Bottom Row of Dashboard Tiles is Situationally Removed
- When a user would view a dashboard, there would always be a row of empty tiles at the bottom, where a report designer could add new content. Now, if a user is unable to edit a dashboard and is viewing one, that bottom row of empty cells we be gone to improve dashboard quality.
- Additional IntegrationStyle Flags for our Front-end Integration APIs
- We’ve added some additional integrationStyle flages to the renderReportViewerPage and renderDashboardViewerPage to give users more control over what is displayed.
- For renderReportViewerPage, the two additional variables are hideReportName and hidePreviewRecords. When set to false these will hide the name of the report and the preview records dropdown respectively.
- For renderDashboardViewerPage, the additional variable is hideDashboardName. When set to false the name of the dashboard and the global checkbox will not be displayed.
- New Dashboard Tile Header Permission
- For end users who are only viewing the report, the dropdown header on dashboard tiles may not be necessary. Because of this, we’ve introduce a new permission, ‘Display tile header in uneditable dashboard’ in the role permissions setup. If this permission is not enabled, then when a user opens a dashboard that they cannot edit, the blue tile headers will not display. This mirrors the behavior seen in the report viewer and simplifies a user’s interaction with dashboards.