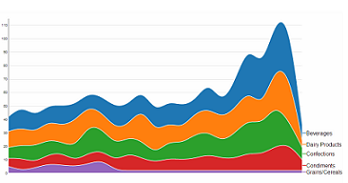
We’ve launched Izenda version 6.8, a new update with a lot of great new features that will help users better understand and envision their data.
Introducing the New Izenda Vision Module
 The Izenda Vision add-on product gives you advanced visualizations including sunbursts, heatmaps, waterfalls and more, to empower your end users to display and make sense of their data in completely new ways. You can see the entire set of visualizations in our gallery.
Users can also select a chart format for their report even more easily, using our one-click visualization functionality. Hover over the smart bar to choose the color palette, chart style and metric. Instantly update data by clicking on a visualization. Version 6.8 also has new Auto Chart functionality, which lets users explore data visually, instantly transforming their reports into different chart styles.
Other new features in Izenda Reports include:
- Easier integration with HTML5 applications
- Support for the latest browsers and Jquery framework
- Core chart types in the Report Designer with a new, modernized look
- Enhanced responsive design in grid, charts, toolbars and breadcrumb trails for better mobile viewing
- Open and simplified CSS for streamlined integration
- High performance bulk CSV implementation functioning as a streaming operation
- Additional Foreign Language Pack enhancements
- Multiple Data Source Aliases for complex joins
- Secondary keys for advanced drill-downs
You can request a demo with a product expert, or download the newest release from the website.

