Using Time Compression Instead of Cubes to Deliver Rapid Data Analysis
The term “data warehouse” may have originated because it once took a literal warehouse to hold all the servers you needed to store a few gigabytes of information. We now live in extraordinary times where USB drives given away as promotional items can store the equivalent.
The approaches to storage taken by data professionals have not caught up to the unfathomable progress hardware has made. This article presents a simple approach to leverage all of this horsepower in order to provide rapid analysis of terabytes of information with relatively little effort. If you are on relatively new hardware, this will work on your existing SQL database without requiring any additional hardware, software, ETL or replication technologies.
OLAP vs. OLTP on SQL Databases
Traditional systems architects liked to separate analytical OLAP queries and OLTP transactional queries. This was often necessary due to the limitations of hardware and software. While many third party frameworks exist for analyzing data, the SQL language can actually handle the bulk of business requirements needed by the average knowledge worker. This approach is generally called Relational OLAP or ROLAP. There is no need to copy the data into a separate piece of software such as MDX for the majority of today’s business requirements.
Speed Dating
While we are privileged to live in a world of cheap, abundant memory, we also have the responsibility of having to deal with vast quantities of data. We are going to use date aggregation to compress data so it can fit in system memory, which is still many orders or magnitude faster than spinning hard disks. With 64-bit systems now commonplace, a system capable of addressing more than 32 GB of memory can be had for a few thousand dollars. Using date based aggregation, the compressed results can fit into system memory.
The Temptation of a Faster Model
Faced with the double challenges of hiding users from database complexity; many BI vendors and consultants decided that the boring old SQL model wasn’t sexy enough to justify their price points. They came up with proprietary modeling technologies that maximized query performance as well as billable hours. Today MDX has emerged as a standard way to model complex data. While MDX is a wonderful technology, very few IT folk have the patience or the mental fortitude to master MDX. If you have one, treat them well because they are expensive and very hard to replace. Cubes technologies were the only option when servers came with 32 MB of memory while today’s systems have nearly a thousand times that available. Now that commodity hardware can run billions of records in seconds without specialized hardware, much of the appeal of Cubes technologies is eliminated and the enormous costs make the investment questionable.
Speed Dating Details
Doing aggregate compression will accomplish the same results as using MDX or Cubes technologies, but with significantly less investment in time and resources. Rather than using complex data models to cache data in lots of specific ways that have to be continually defined and maintained, we make a grand overarching aggregation. We pick a level of granularity (such as days or hours) and we compress all of our reportable data the same way. I may have many thousands of transactions each day, but may only care about reporting by days, months or quarters. If I aggregate down to the daily level, an excellent reporting front end like Izenda Reports can let users visualize and navigate the information easily. This code shows how you would apply a yearly granularity to all your dates.
DATEPART(year, OrderDate) AS Year
Since a year is usually not granular enough but a day is, we’ll have to do a little bit more. Since none of the DATEPART methods support getting the entire date without the time, we do a little trick with using DATEDIFF and DATEADD. We don’t want anything that is smaller than our daily granularity as that would reduce how much we compress the data through aggregation. Note that this does not compress the actual data. Instead it creates a view which takes up a lot less space and can potentially help with memory.
DATEADD(D, 0, DATEDIFF(D, 0, OrderDate))
Writing the SQL Code
Let’s use the Northwind Orders table as an example. We’ll create a view off this table to simulate a much larger data set. We create a view to aggregate all of the records down to a single row for each dimension for each day.
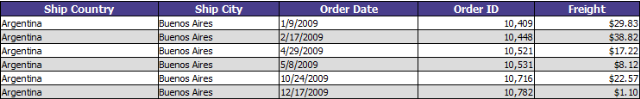
So the original data looks like this. We have ShipCountry and ShipCity as geographic dimensions, OrderDate as a temporal dimension and OrderID and Freight as attributes which we will turn into measures:
We’ll use the following SQL to create a view that does temporal compression on our OrderDate field. The DATEADD is needed because there is no DATEPART format that does the date without the time. If we averaged 100 orders per customer per month, this would give you 99% data compression and would allow a 1TB table to squeeze into 10 GB of memory. A system with more than 10 GB of memory could essentially cache an indexed or materialized view in memory to deliver exceptional performance:
CREATE VIEW OrdersView AS
SELECT ShipCity,
DATEADD(D, 0, DATEDIFF(D, 0, OrderDate)),
COUNT(OrderID),
SUM(Freight)FROM dbo.Orders
GROUP BYShipCountry, ShipCity,
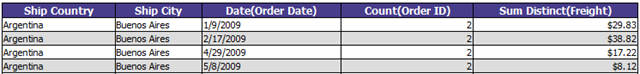
DATEADD(D, 0, DATEDIFF(D, 0, OrderDate))The results look like this and can serve as a high performance data source for reporting tools like Izenda Reports.
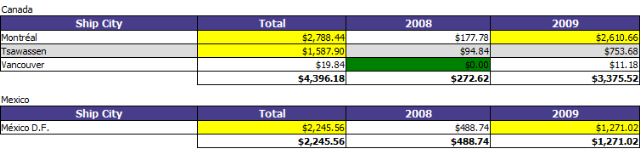
A self-service tool like Izenda Reports could then power an advanced high performance pivot analysis like this.
We now have a much smaller data set to work with and our indexed view combined with gigabytes of memory will deliver high performance real-time results on this data with daily granularity. If each customer places 100 orders per day, we’ve reduced our working set 99%. A full TB of data could be cached and rapidly analyzed in 10 GB of system memory. We can now give users access to it with a self-service reporting tool like Izenda and go on vacation!