Izenda Reports 6.4 (6.4.4314.14409 to be exact) is now officially available for existing customers on their download page, and we have 11 great new and updated features for you:
1. Smart joining of data sources
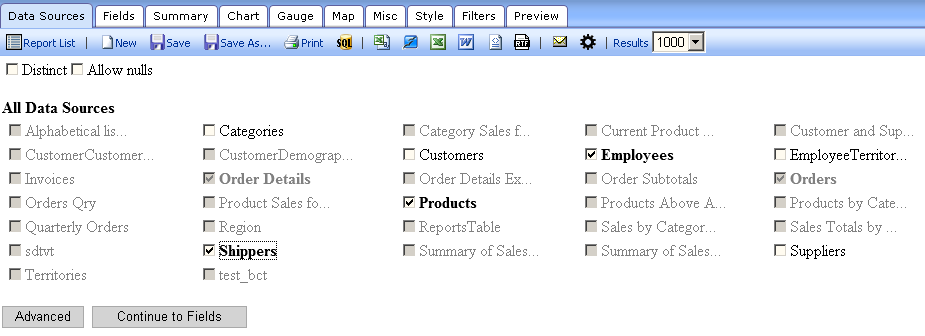
Data sources in version 6.4 with complicated relationships can be selected with just several mouse clicks. Izenda Reports deduces the table joining relationships for the user. A new simplified data sources GUI allows selection with ease by graying out check boxes to prevent nonsensical joins.
Code sample:
[vbnet]
AdHocSettings.ShowDataSourcesAsCheckBoxes = true;
AdHocContext.Driver.AddConstraint("User.Id", "Account.OwnerId");
[/vbnet]
You can watch a screencast about the release here.
 Smart Join Data Sources
2. User defined constraints with wildcards
New virtual constraints are easy to add in Izenda Reports. Complicated schemas no longer require extensive user education or the changing of database schemas. Virtual constraints allow Izenda Reports to know about all connections between tables. Users can even run reports on Sales Force databases without reshaping the schema. These may be required to use smart join.
Code sample:
[vbnet]
AdHocContext.Driver.AddConstraint("Account.Id", "*.AccountID");
AdHocContext.Driver.AddConstraint("User.Id", "*.OwnerId");
AdHocContext.Driver.AddConstraint("User.Id", "Account.OwnerId");
[/vbnet]
3. Time period slider in dashboards
Updated, immediate results from a new control which allows easy and fast adjusting of the time period for all time period filters in dashboard reports.
Code sample:
[vbnet]
AdHocSettings.DashboardDateSliderMode = DashboardDateSliderMode.Auto;
[/vbnet]
 Time Period Slider
4. Grids with gradients
New visual enhancement added to traditional tables with data. Now you can catch exceptional data with just a passing glance at the grid.
Enable in 6.4 by checking the “Gradient Cells Shading” box in the “Advanced Field Settings” dialog box.
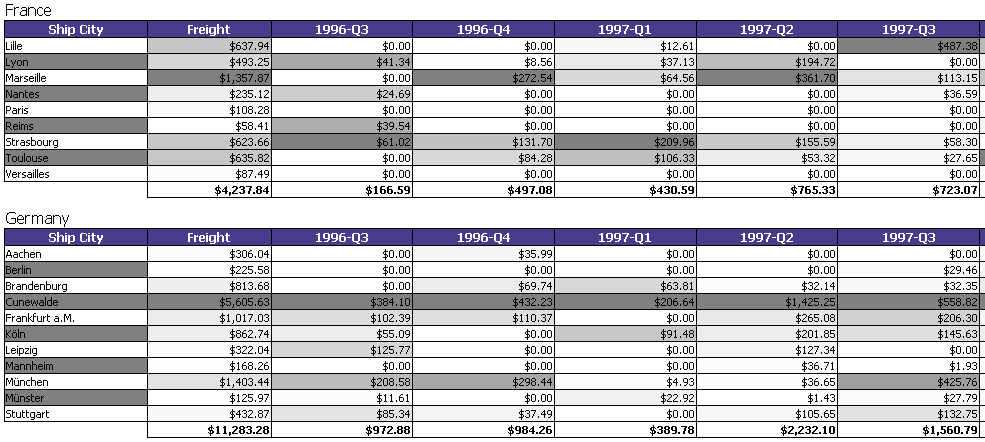
Exceptional Data Gradient Grids
5. Locked report mode
Restrict users from adding or removing filters or fields in the Report Viewer, but still allow them to change an existing filter’s value by using the new Locked report mode.
Enable this feature in 6.4 by selecting it in the Misc tab of the Report Designer.
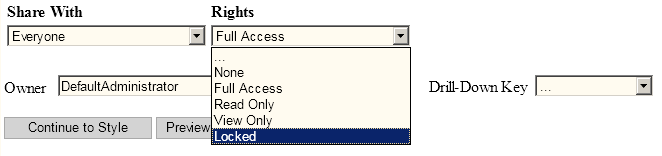
Locked Report Mode
6. Calendar controls for date selection
Typing dates into filters frequently leads to errors. New, convenient calendar controls cut down on data entry times and reduce mistakes.
Code sample:
[vbnet]
AdHocSettings.ShowBetweenDateCalendar = true;
[/vbnet]
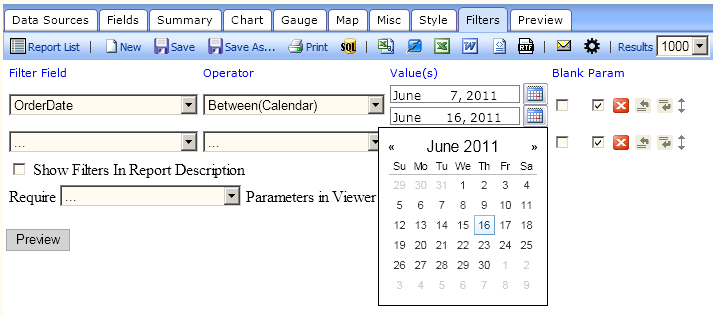
Calendar Controls
7. Colorful gauges
New gauge feature allows color palette selection with a single text box.
Enable it by filling in the “Color” text box in the Gauges tab.
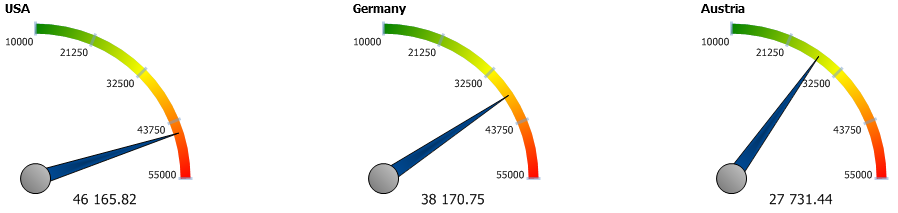
Colorful Gauges
8. Saving From Report Viewer
Adding save controls to the report viewer allows rapid saving of changes to the report filters without having to re-enter the report designer. Overwrite the existing report or save a new copy.
Code sample:
[vbnet]
AdHocSettings.ShowSaveInReportViewer= true;
[/vbnet]
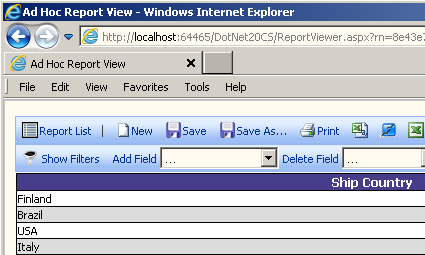
Saved Report Settings
9. Customizable dashboard filters
Dashboards now have individual filters which can be customized to your design and function. Just add a customized DashboardFilters control to the Izenda Reports directory and use logic in the code behind to control its appearance and function. To add a customizable dashboard filters, a custom user control named DashboardFilters.ascx must be created. If found, this control will be inserted into the dashboard viewer below the toolbar.
The files must follow this naming scheme since Izenda Reports looks for the control with the name “DashBoardFilters” and loads it.
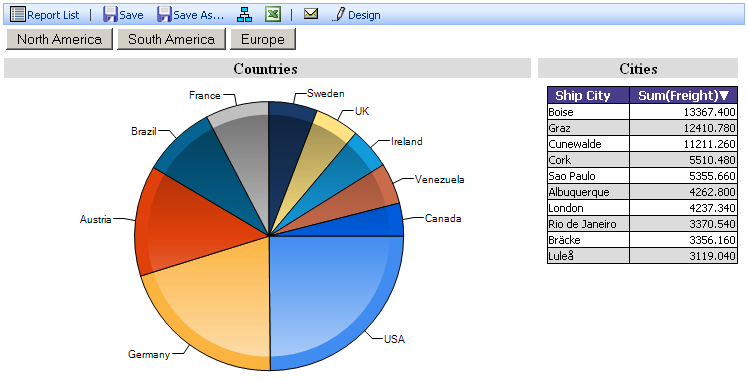
Custom Dashboard Filters
10. Horizontal bar charts
Introduce variety into your reports by using a horizontal bar chart.
Code sample:
[vbnet]
AdHocSettings.AllowHorizontalBarChart= true;
[/vbnet]
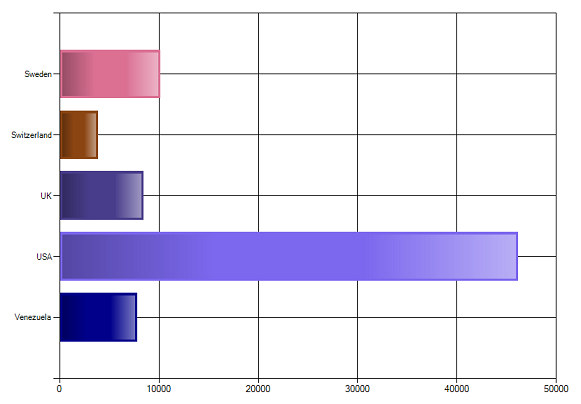
Horizontal Bar Charts
11. Scheduling for specific timezones
Need reports for branches located all over the world? No problem, simply set the timezone in the reports scheduler.
Code sample:
[vbnet]
AdHocSettings.ShowTimeZoneDropdown = true;
[/vbnet]
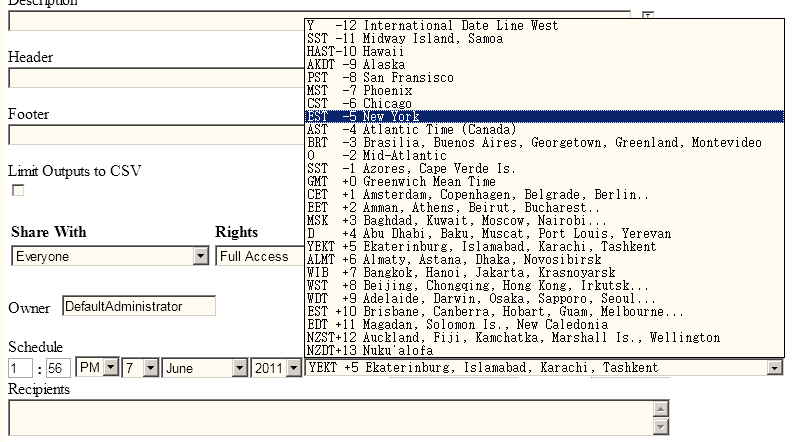
Schedule by Time Zone
Hi,
I would like to see another helpful feature on Izenda as, for sub report provide the tool to create dynamic URL based on folder/report name and report parameters. in current URL textbox, if you want to customize the URL , user has to go through syntax issue, instead of that have an option to build URL by selecting folder/reports and param1, param2, etc.. values.
Thanks
Mangesh