Telling a Story with Data
While the existence of a massive amount of raw data can look impressive, often it takes a great visualization of that data to tell the story of what the data truly means. Graphs, pie charts and other visualizations are used regularly to elucidate important trends that might otherwise go unnoticed.
We think of data visualization as a modern phenomenon, one dependent on digital data on a computer database or in a file. But here are some famous data visualizations, most of which pre-date computing, which have also fundamentally altered history.
Description of a Slave Ship
Today it is hard to imagine an era when the trade in slaves was a hugely profitable business. But getting people to understand the deplorable conditions slaves had to endure was a daunting task in an age that had no photography to document it.
Read More
 Sitting here in my Halloween costume, I got to wondering what kind of data we can collect about the spooky holiday. Read More
 A few years ago the Harvard Business Review called data scientist the sexiest job of the 21st Century. Demand continues to outpace the supply of data scientists, so positions command a healthy wage.
  Organizations keep generating more and more data. You’d think they’d learn something from all this information. But data analytics are pretty tough when few of the people with access to that data know what to do with any of it. For any hope of gaining insight from this information, they need to achieve data literacy.
  The modern idea of Business Intelligence (BI) has been used by big companies since the early days of data warehousing. BI didn’t start out as a complicated set of data analytics. Going back as far as there were people doing business, proprietors used BI to improve their odds of making a sale. The age of big data changed the rules somewhat, but that doesn’t mean that the game can’t be played by both big and small businesses. If you run a small business and think that BI and analytics are only for big corporations and only they can afford it, you couldn’t be more wrong.
 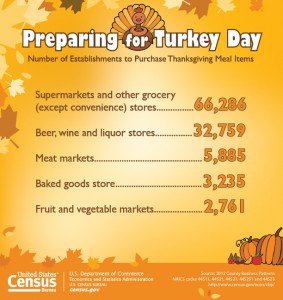 Hopefully, you also are enjoying the day off, with at least a four-day weekend to enjoy time with family, friends, turkey, cranberry sauce, stuffing (dressing here in Georgia) and, of course,
  At the risk of sounding glib: real-time analytics are, well, analytics that happen in real-time. This capability means that you are constantly in the loop on metric performance as the data comes in. Think of it as “live on the scene” reporting of the metrics you care about most.
  Depending on who you are speaking with, analytics means different things to different people. Listening to industry webinars and reading blogs about business intelligence and analytics, it’s clear that not everyone consistently distinguishes between different types of analytics – or even consistently acknowledges that there are different types.
 Companies in the midsize market want to invest in business intelligence and analytics solutions, but they can get stuck on cost and not knowing how to approach BI.