Embedded and Branded
Read how this leader in product completion, logistics, eCommerce and supply chain management has embedded Izenda into their business. You can contact Arvato Bertelsmann at http://www.arvatocim.com
 Why did you choose Izenda?
Arvato created a robust collection of modules within “Vision”, a web application for use by our internal and external users that provides a feature-rich face to our back-end logistics application, all written in-house. While Vision has modules for managing orders, parts, operations, tickets and more, the cornerstone of our Vision tool had to be our Reporting module. We absolutely needed to get this right as this is where our users have so much “vision” into most aspects of our operations and capabilities. In short, our back-end systems have always been cutting edge, but the reporting module would drive how our customers actually perceive us. A company’s success is driven not only by actual performance, but by perception, and this was our chance to give our customers a stronger perception of our capabilities through real-time vision into our data. We had to get this right, and with the help of Izenda, we did.
We wanted a tool that met the following requirements: 1. An HTML report designer that did not require client-side software installation. a. Our Vision users work on tightly controlled computers with locked-down security settings. Installing report designer rich-client software was not an option for us. b. We believe in basic simplicity where possible, so eliminating the need for a rich-client download is one less puzzle piece of the system architecture to worry about.
2. It had to be easy enough to use for non-technical users. a. While creating a report often means understanding aggregates, grouping logic, complex filtering and a solid understand of data relationships, we really wanted to provide non-technical users a realistic means for them to create reports that were traditionally only done by IT personnel – data base programmers. So many companies claim their tool accomplishes this, but we found that very few had the proper balance of power and ease of use for our needs. We understand not all business users will understand how to create a pivot report or trend reporting, but we wanted them to feel they could create more simple reports and even enjoy the process. The age-old challenge of balancing Power vs. Easy-of-use was a primary focus for us and we needed a tool that we could manipulate and leverage built-in functionality in complex reporting to attempt to create a strong balance of power and ease. Izenda gave us a solid framework upon which to succeed in this challenge.
3. While it was a browser-based designer, we wanted it to be responsive in both designing a report and in running them. a. Most tools we played with performed sluggishly while designing reports, even on our fast development PC’s, and did the report output page rendering on the server rather than allowing the client browser to render the report, taking advantage of the faster performance usually attained by letting the user’s computer do some of the work. iZenda took a more simplified browser-based approach, allowing more basic HTML page rendering that was very responsive. b. We found our users prefer quick access to the raw data over the delay in getting Flash or other “fancy” presented data which tool substantially longer to present to them. The “peppy” feel of Izenda, quite honestly, was an important factor in our decision to choose it. c. Most users feel frustrated with sluggish software even if the output comes with more bells and whistles. These bells and whistles often come at yet another price: browser compatibility and computer performance. We needed to keep Vision looking and performing well on old machines running old browsers.
4. We needed to do a high level of integration into the tool with our Vision framework such that user permissions and many other Vision-centric concepts would be fully supported as if it was designed around our Vision product. a. Izenda code has hooks that allow us to modify its behavior and enhance integration with Vision to have it act and look how we wanted. b. While Izenda comes with quite a bit of functionality out-of-the-box, there is a significant level of customization we needed to incorporate into it to merge it seamlessly into our complex Vision web portal environment. Even things we felt could be very challenging to implement proved to be quite successful, such as automated user-permission auto-filtering of data. c. Examples: i. The same report, when run by Robert, will show him completely different data than when Glenda runs the same report with identical filters because they both have user access rights to different sets of data, all within the same tables. ii. When Glenda modifies a “standard” report she can save it and publish it to anyone at or below her team on the hierarchical User Tree: to certain individuals, to entire teams, or any mix thereof. With hundreds of users creating countless reports, the concept of publishing these reports to a targeted audience is critical so users don’t effectively get spammed with too many reports from people they don’t know.
5. The tool needed to be flexible enough so we could change the GUI considerably to meet the Vision style guide. a. We put considerable effort into the Vision GUI design and it was important for us to find a tool that allowed us to re-skin the product to match our standard. Izenda proved to be very friendly in this regard; so much so that we put an entirely new skin on all the major screens of the report designer. This gave us the look we wanted to match the overall Vision style and provided a rich report designer GUI experience beyond what Izenda provided out-of-the-box which was important for the type of business users we have using the tool.
6. The company behind the tool had to be stable enough to keep the product not only alive for years to come, but continually enhancing it so our users of Vision get the new features as well. a. While we write a great deal of software, creating a powerful reporting tool from scratch would be a very significant effort indeed. We believed we could find a reporting tool that allowed enough customization to make it look like we wrote it, but the tool would continually be enhanced by the authors of it and we would benefit from the continual upgrades to it. Izenda has shown this to be true for us so we can focus on other features of Vision and let Izenda focus on powerful reporting features.
How did you successfully embed Izenda? One of the biggest benefits when integrating our Vision web application with Izenda’s reporting tool is the robust set of method and functions built into it. Nearly anything we wanted to do to the product to change its default behavior we were able to find an integration point to accomplish it. As a result users who work with Vision’s reporting module see and experience things as we designed it for Vision. It is not at all obvious that they are in fact using an external product from Izenda that we configured to fit into our design.
We found the integration of Izenda into our Vision system straightforward. Just like any integration it had its challenges, but Izenda’s product has an easy-to-follow architecture and design allowing for seamless integration in areas such as user permission. We were able to carry our single database structure for multiple clients and enforce preset group/user “hidden” filtering without having to create separate reports for each scenario. This increases productivity since we can provide all our users with one “Standard” report that will only contain the data specific to their user permissions as the SQL WHERE clause filtering the dataset automatically gets enhanced with our user permissions.
Even the user experience within the UI is configured based on the user role. More powerful users get more functionality via more UI controls while we allow the user experience to stay significantly more simplified for users we don’t want to scare with too many options/buttons.
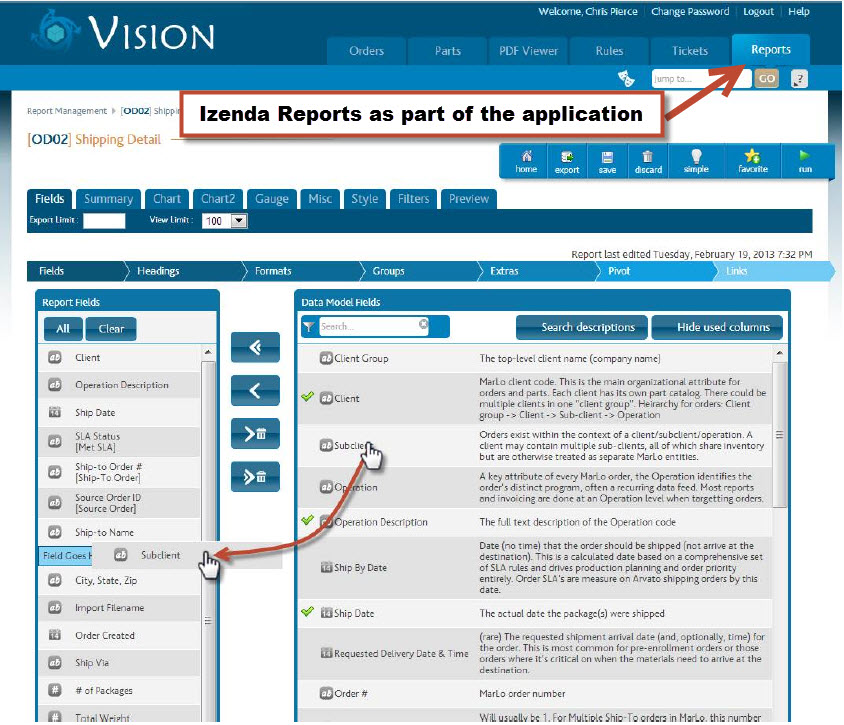
We introduced a “data model” concept as a layer of data abstraction that we created and sat Izenda upon, so users don’t create their own data sources; they simply choose from a carefully crafted set of data base views that become a shopping cart of “data models” from which to base a report upon. Thus one data model can serve hundreds of reports, all different, yet all SQL tuned and accurate. If we enhance a data model, all reports based on that model can then make use of the new fields or other enhancements. These data models handle all the table joins and query hints needed to perform well in our large data base environment. This data model concept is key for us and, while not inherent in Izenda, proved to integrate well with it. Izenda has its own concepts around data sourcing which are fine, but we chose to go another route and we were able to quite successfully integrate our concepts into it.
To further enhance the user experience, our data models contain rich attributes for each field they present, including friendly field names (“BACKORDER_QTY” becomes “Backorder quantity”, translated from the actual data base View to what users see in Izenda), full descriptions for each field, default filter operator behaviors, date range restrictions to ensure fast execution time when needed, cascading combobox lists with parent/child field links and permission-based combobox options per user, and much more. This made the report creation process come alive with richness beyond standard Izenda functionality and the level of integration points allowed this high level of customization.
In a sense, we created our own report designer screens and concepts atop Izenda’s robust built-in functionality while allowing the Izenda report execution engine to remain fairly intact. We believe this was an effective marriage of customization and standard functionality only possible due to the high degree of integration methods Izenda provided us.
How did ad-hoc reporting impact your business? Reporting has always been a cornerstone strength of Arvato. Given that the entire data base application was written in-house, we have incredible control over all aspects of data storage and manipulation, therefore the “we can give you any report you want” sales mantra is truly a reality for us.
For years our ad-hoc reporting was created by our IT team who would send SQL queries to the business team who could run and tweak those queries to some degree using a simple tool we built in-house. But the amount of tweaking was quite limited as we cannot expect non-technical users to add tables and properly do joins and generally keep the query tuning under control. They could, for example, change date ranges and other constants.
Enter Izenda. Having a true reporting tool like Izenda has revolutionized our ability to provide data to our users. The data has always been there, but now we have a powerful, yet business-friendly tool that lets non-technical users create reports in nearly any way they wish. How our customers see our reporting capabilities now is entirely revolutionized. They no longer have to wait for someone from our company to email them an ad-hoc report result; they can simply create their own report, and they can save it and refine it as they wish. They can publish it to whomever they choose and they can be sure that the data they get is accurate and auditable against other reports because the “data models” we’ve created for them ensure accuracy.
Izenda has made “reporting on demand” a reality for both our internal business teams and our external clients as well and while this has been a real boost to our users, it’s also been a significant IT manpower saver as well as users can now create their own reports without the need for IT to create ad-hoc reports for them. Furthermore, if one person in IT creates a query per an ad-hoc request, it may return different results from another person in the IT team as a result of interpretation of the requirements, or even technical mistakes made or assumptions made. Many hours were spent trying to determine why report A doesn’t confirm data from report B only to find that A and B were inherently similar but different in rare cases because the purpose of the query was slightly different. This whole problem is now eliminated due to our data model concept. Report A and report B now use the same data model. No matter how you spin the data in Izenda report, you will get numbers that agree with each other. This benefit cannot be overstated, both for the business teams and the technical team.