Izenda customers answer specific ad hoc reporting needs with our embedded analytics platform. In the Izenda offices, our engineering team puts the 7 Series platform to work monitoring and tracking the performance of in-house servers.
Like other software companies, we operate a number of servers for a variety of things: proofs of concept, demo sites, test databases, etc. A good log management system helps to ensure that these servers are available and secure.
Our engineering team deployed a logging system using Syslog for log collection and the Izenda 7 series to report and analyze the log data from Windows and Linux servers, firewalls, etc. The current system is capable of processing millions of server logs.
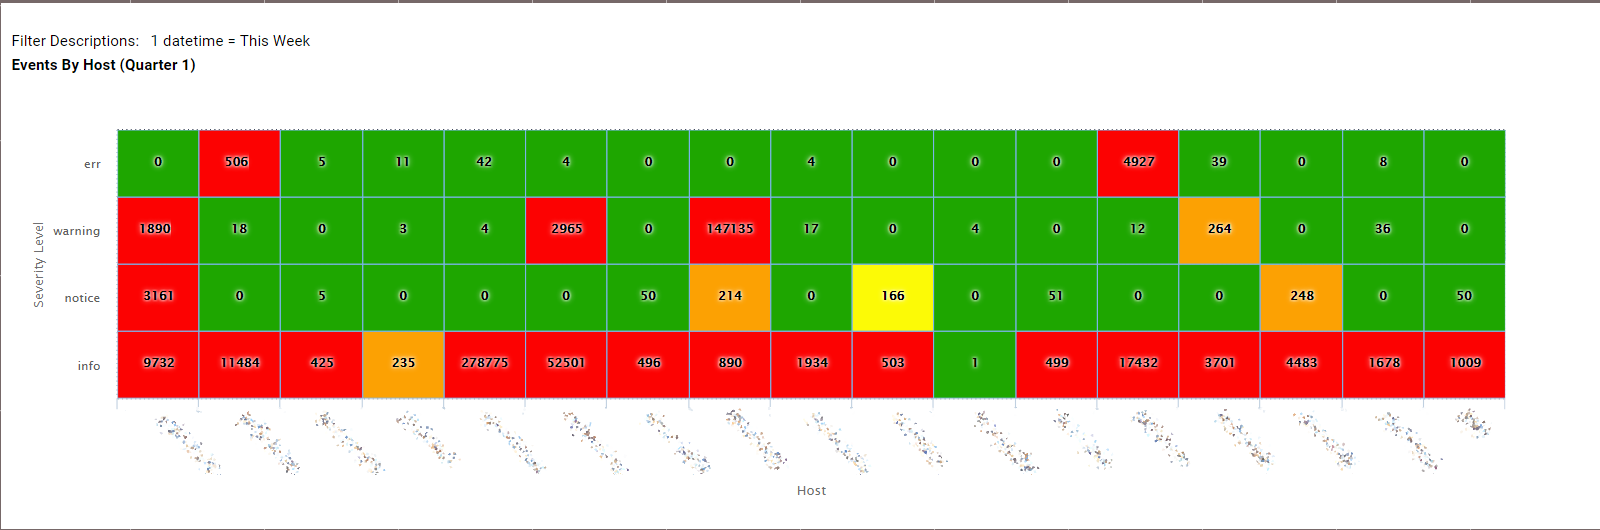
The application can reveal DDoS attacks and automatically send alerts the appropriate staff member. Logging in to the application reveals dashboards that contain visualizations like gauges and heat maps with color-coded thresholds and drill-down functionality that expose problems and show trends with the servers.
 These dashboards also serve as a sort of situational awareness display on a large TV in the engineering room. At a glance, any engineer could see what’s happening with the servers on the screen. However, since they couldn’t keep their eyes on that screen all the times, it was easy to miss an important event. When the team members were in conference rooms, meetings or out of the office, the servers couldn’t be monitored effectively.
To address this limitation, the application was configured to use alerts. When certain events or trends occur, the appropriate team member(s) receive alerts via email notifying them of any issues. For instance, if a server is running out of disk space, or there are excessive failed login attempts, the application sends an alert to the appropriate parties. This approach allows the servers to be monitored even after regular office hours.
The server log reporting application fills the role that could be handled by log management solutions by Splunk, Graylog or Elastic’s Kibana.
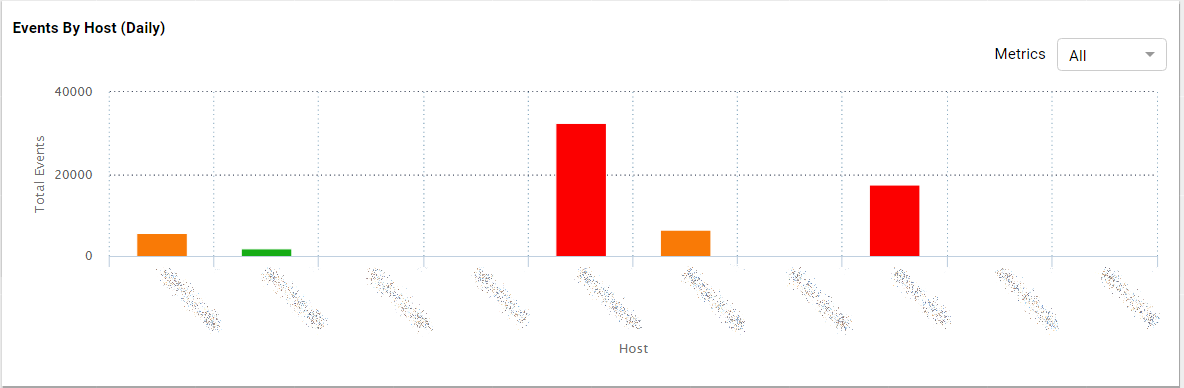
Like those log management solutions, the server reporting application collects Syslog and EventLog messages. It delivers daily, weekly and monthly reports to spot and track trends. But because Izenda can report against real time data, the application also operates in real time to keep a close eye on the condition of the servers.
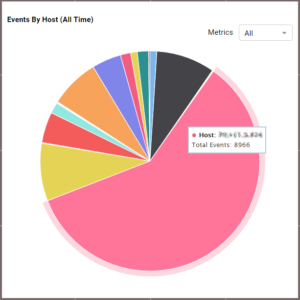
The events tracked include Notice and Informational alerts. The reports can be filtered, for example by type of server or type of event:
- Informational event, like when a database starts up
- Warnings and notices, for example, if a server is running low on available drive space
- Error event, for example, if a database fails to start
The benefit of these reports is that they give the full message, without requiring that you log into each server.
The application server is also monitored by this system. By pulling in this server’s log data, Izenda’s Customer Success team can tell who has downloaded updates, from what IP and at what time
The engineering team said it’s much easier to look at these server logs in one place, instead of touching each one of them via individual servers. Their server log reporting application using the 7 Series Platform includes the ability to email daily reports, pdf reports to management or security teams as necessary. Instantly team members get informed of our servers’ security status.
This solution makes use of the 7 Series caching abilities. The first step is the Syslog server, which acts as a collector of all logs from the 10 servers. A single MySQL database collects log information from all servers. And the server reporting application reports off of that database.
The application stores values rather than having to regenerate them each time First-Time queries update an in-memory cache. This works more efficiently than pulling all of the server log data from the database each time.
The application stores data indefinitely, which is good for compliance reasons. Users of the application could research activity on a specific date and time. The engineering team continues to develop that delicate balance between getting the information that’s needed and not being overloaded, which would be easy with millions of events recorded.