 In July 2011, Gartner released a report “The Consumerization of BI Drives Greater Adoption.” Its main focus, the thinking at that time, was that business-intelligence tools were too difficult to use, slow to respond or didn’t deliver relevant content. A key sentence from Gartner’s press release: “BI users want to be able to just pick up and use the technology — they don’t want to have to read the manual.”
Today, Gartner, Gigaom Research, Forrester and others are all focusing on the benefits of self-service BI. Gigaom, in a recent white paper underwritten by Izenda, explored the importance of embedding BI tools inside applications. “Reporting and analytics must be embedded inside applications and end-users must be able to use their interfaces not just for running reports, but for designing them,” analyst George Anadiotis wrote.
It’s no surprise that end-users, whether digital natives or older consumers weaned on Amazon, Google and Facebook, have high expectations that the applications they use at work are modern, portable and easy-to-use. In a data-driven world, they want to create their own reports, dashboards and visualizations when they want it, where they want it and on whatever device they are using.
Business Intelligence 3.0
Bill Cabiro, Managing Director at Strat-Wise, explores the ongoing change in BI tools in his post “What is Business Intelligence 3.0?” He refers to the many names, depending on the vendor, for the current software class: Data Discovery, Advanced Visualization, Visual Analytics, Business Discovery, Self-Serve Business Intelligence or Business Intelligence 3.0.
Whatever the name, the tools’ ease-of-use is central to adoption in any organization. Adoption remains the holy grail for those investing in BI platforms.
Writes Cabiro: “The new user-friendly and intuitive visual analytic tools are helping companies exploit the treasure of business trends, patterns and opportunities hidden in their oceans of data by increasing the number of employees that participate in the data discovery process. The technology enables casual users to transition into power-users and power-users into app developers in a matter of weeks.”
Three Stages of BI Development
The transition to modern BI approaches didn’t happen overnight.
Capgemini’s Simon Gratton wrote about the transition to BI 3.0 in a 2012 post. A quick summary of the three stages of BI development as he described them:
BI 1.0: A tool-centric approach involving Batch processing, tightly controlled by IT department, with information delivered to trained analysts. (Today, that would include data scientists.)
BI 2.0 (which includes BI 2.5, which he said papered over the cracks of 2.0.): A Web-focused approach with near real-time processing, jointly governed by IT and users. BI 2.5 brought in more functionality, including visualization. However, Britton saw the main shortcoming: “These systems provided more power and scalability and, provided greater agility and simplicity for the IT developers; but not necessarily the business consumers.”
BI 3.0: A mostly app-centric approach to BI, identifiable by an anywhere, anytime and device or platform independent collaborative methodology. As he wrote: “I collaborate via any device with context, harness information on-the-fly and drive outcomes.”
That’s the history. The present: Independent software vendors, solutions providers and enterprises are increasingly understanding the value of putting easier-to-use tools, mobile BI, and visual data discovery in the hands of all levels of the organization. The very near future: By 2017, Gartner says the majority of business users and analysts will have access to self-service tools to prepare data for analysis.
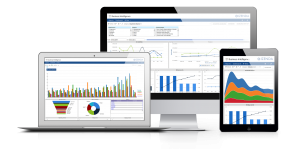
With Izenda, every page within your application can have interactive gauges, charts and detailed reports effortlessly embedded.
Follow Izenda on social media for the latest on technology and business intelligence:
![]()
![]()
![]()